Jon Sneyers, Cloudinary Research
Mohsen Jenadeleh, Universität Konstanz
Dietmar Saupe, Universität Konstanz
May 2025
Recently, the upcoming JPEG AIC-3 image quality assessment methodology (ISO/IEC 29170-3)
has been applied to high dynamic range (HDR) images.
AIC-3, now in the final stages of standardization, is a new procedure for fine-grained subjective testing of the visual fidelity of lossy image compression.
In this article, a high-level overview is given of the AIC-3 methodology and the experimental results that were obtained.
After the megapixel race of the past decades, modern cameras and displays can capture and reproduce images at very
high resolutions. At this point, what really matters to further improve image fidelity is no longer the number of pixels,
but rather the quality of those pixels. Higher precision (in terms of bit depth) allows representing a wider color gamut
and a higher dynamic range, getting closer to reproducing reality as perceived by the human visual system.
At the same time, lossy compression is typically still required to reduce the cost of storage and transmission of images.
Obviously any improvement in display fidelity is pointless if it is outweighed by compression artifacts.
For this reason, image quality assessment is crucial and in particular in the high-fidelity range.
Quality range
Traditionally, image quality assessment is performed using methodologies such as BT.500 ACR or DCR (DSIS), as described in
JPEG AIC-1. Quality is expressed as a mean opinion score (MOS), and a broad but coarse-grained range of distortion levels is used,
covering the spectrum from bad quality to excellent quality.
Typical examples are these images from the TID2013 dataset, which includes JPEG-compressed images at 5 distortion levels:
JPEG, distortion level 1 MOS 5.78, CI: [5.48, 6.08]
Source
JPEG, distortion level 2 MOS 5.70, CI: [5.50, 5.90]
Source
JPEG, distortion level 3 MOS 4.60, CI: [4.36, 4.84]
Source
JPEG, distortion level 4 MOS 3.18, CI: [3.02, 3.34]
Source
JPEG, distortion level 5 MOS 1.87, CI: [1.71, 2.03]
JPEG, distortion level 1 MOS 4.03, CI: [3.69, 4.37]
Source
JPEG, distortion level 2 MOS 3.97, CI: [3.67, 4.27]
Source
JPEG, distortion level 3 MOS 3.35, CI: [3.03, 3.67]
Source
JPEG, distortion level 4 MOS 1.43, CI: [1.15, 1.71]
Source
JPEG, distortion level 5 MOS 1.23, CI: [0.99, 1.47]
Source
You can click (and hold) the 'Show original' button or the keyboard key S to see the source images instead of the distorted ones.
Besides the MOS score itself (where higher numbers indicate a higher quality),
a 95% confidence interval (CI) can be computed to express the statistical precision of the experimental results.
Practical applications of image compression typically do not apply extreme compression since the distortion would
be unacceptable. Instead, the goal is usually to have images that do not have any obvious artifacts.
However, the traditional testing methodologies do not provide precise, fine-grained results in that quality range.
The confidence intervals are essentially too wide to reliably differentiate subtle distortions.
In the examples above, for the highest distortion levels (lowest qualities), the confidence intervals are narrow enough to clearly differentiate
these distortions. But for the lowest distortion levels — the kind of quality most relevant in practice —
the MOS scores saturate while the confidence intervals get wider.
The JPEG AIC-2 methodology was designed to accurately determine the threshold where images become visually lossless,
but it only defines a binary result (visually lossless or not), not a quality scale.
It uses a rather strict criterion of visually lossless (a flicker test), and compression methods that meet this
criterion typically require high bitrates.
In many applications, a somewhat lower fidelity is still acceptable, or an even higher fidelity is desired in
order to leave (more) room for color adjustments in post-production. The AIC-2 methodology however only provides
a single threshold.
One of the goals of JPEG AIC-3 is to better cover the higher-fidelity quality range from 'good' quality
up to mathematically lossless — the range that actually matters in practice, especially for HDR images —
and to have a fine-grained quality scale in this range.
The AIC-2 threshold is included in this range, which also overlaps with the range where AIC-1 can be applied.
Most importantly, AIC-3 can differentiate qualities that are in or close to the visually lossless range,
while MOS scores from AIC-1 experiments saturate and are too coarse-grained for a meaningful assessment in that range.
The AIC-3 methodology evolved from methods originally developed at the University of Konstanz and at Cloudinary.
It was mainly inspired by the Boosted Triplet Comparison methodology that
was used to create KonFiG-IQA (Konstanz Fine-Grained IQA Dataset),
and by the dual assessment protocol approach
that was used in CID22 (Cloudinary Image Dataset '22).
JND scale
The result of an AIC-3 experiment is a reconstructed quality scale in Just-Noticeable-Difference (JND) units.
A distorted image is defined to be at 1 JND if 50% of the observers can see the difference; in a pairwise comparison with forced choice,
this translates to 75% correct responses when comparing the distorted image to the undistorted source image.
The undistorted source image corresponds to 0 JND, while images with more noticeable distortions correspond to higher JND values.
The JND scale depends on the viewing conditions and experimental setup; in AIC-3, the reference setup is called Plain Triplet Comparison.
In this setup, two distorted images are shown side-by-side, at native display resolution (1:1) and at a typical viewing distance.
There is a button that switches both images (in-place) with the source image, which helps to reveal where there are differences.
Observers are then asked to select the image with the highest distortion.
Only images corresponding to the same source image are compared; 80% of the comparisons are same-codec and 20% are cross-codec.
The test interface for a single comparison question looks like this:
Distorted image (left)
Original image
Distorted image (right)
Original image
Which image has a stronger distortion?
In AIC-3, besides the traditional controlled lab experiment setup,
also a crowd-sourced, web-based experiment setup is taken into account.
Crowd-sourcing implies more heterogeneous viewing conditions and generally a lower reliability of the individual participants,
necessitating good data cleansing methodologies.
In every batch of questions, for each pair of distorted images, the symmetric pair (swapping left and right) is also
included. This allows measuring the consistency of an observer, which can be used as a criterion to filter
out unreliable participants (which tends to be particularly important in crowd-sourced experiments).
The same-codec comparisons additionally allow measuring the accuracy of an observer:
we can assume that for the same codec (and the same source image), a lower bitrate always
introduces more distortion than a higher bitrate, we just don't know how large the difference is and whether it is noticeable to human observers.
In the example above, the response 'Right' would cause the accuracy of an observer to go down,
and again this can be used as a criterion to filter out unreliable participants.
While AIC-3 was originally developed for assessing the quality of SDR images, it can also be applied to HDR images.
HDR viewing conditions
This specific experiment was performed in a lab-controlled environment, to keep the viewing conditions as
consistent as possible.
The viewing conditions were as follows:
Display capabilities/setup:
P3 color gamut
1000 nits peak brightness
100 nits SDR white (3.3 stops of HDR headroom)
Ambient illumination: 5 lux
Viewing distance: 3.1x stimulus height (for the PTC experiment)
In the test, in three of the four labs, MacBook Pro laptops (2021 or later) were used.
These have a pretty good built-in HDR display that can be configured to match the above specifications.
To approximate the lab environment, you'll need to be in a dimly lit room (no daylight or bright lights) and
adjust the screen brightness to get at least 3 stops of HDR headroom.
On a MacBook Pro, this corresponds to a brightness slider position slightly below the halfway point
— you can use Option-Shift with the brightness adjustment keys to make adjustments in smaller steps.
To view the HDR images below, this page is best viewed in a Chrome (or Chromium-derived) browser, in macOS or Windows, on an HDR-capable screen.
At the time of writing, neither Safari nor Firefox are displaying HDR images correctly.
HDR compatibility check
Detecting browser support for HDR... (javascript has to be enabled for this)
Click the button above (and give permission) to see your current HDR headroom.
You may have to first enable this Chrome flag: chrome://flags/#enable-experimental-web-platform-features
PTC conditions: plain comparison with in-place switching
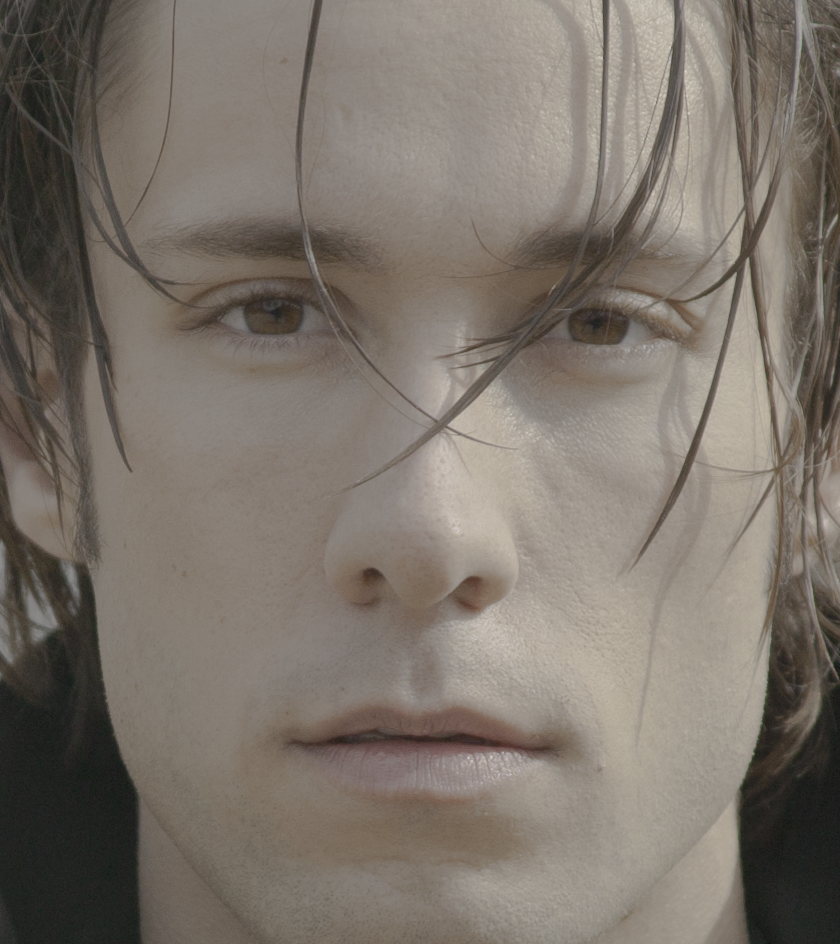
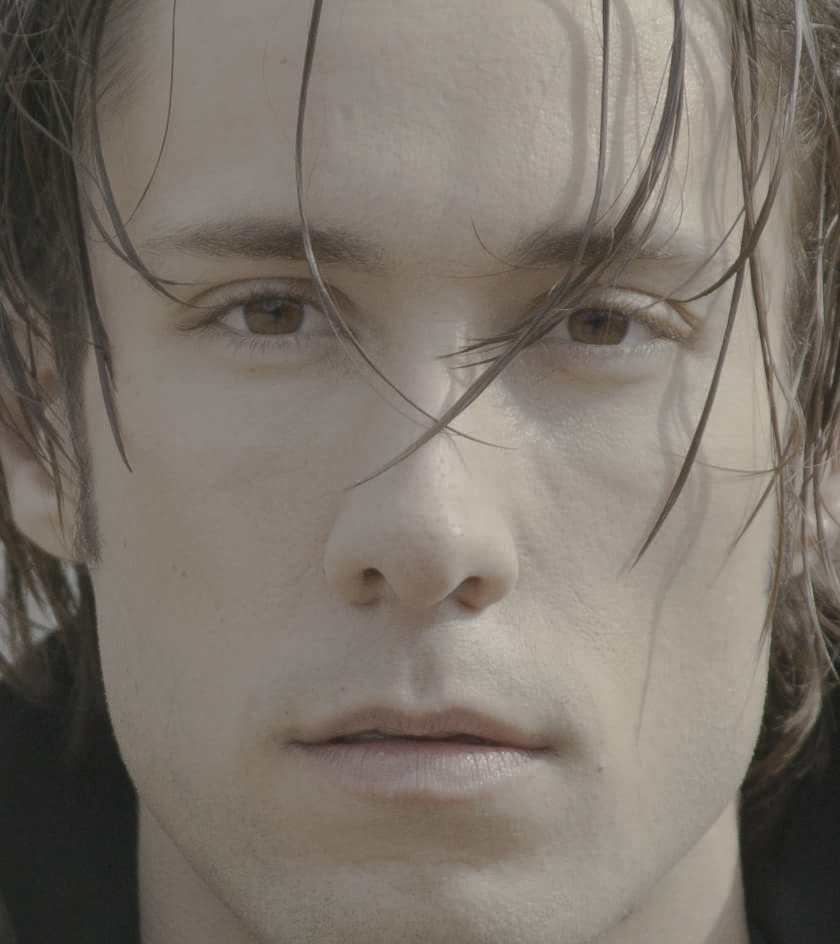
To get an idea of the range of distortions considered, here are the distorted images for one codec/source combination,
with bitrates decreasing from 1.5 bpp down to 0.5 bpp. which corresponds to distortions increasing from 0.5 JND to 5.5 JND:
The distortions range from very subtle to quite noticeable and even annoying, although they do not get nearly as strong as the distortions
considered in typical image quality datasets like TID2013 and KADID-10k.
The size of the steps between consecutive distortion levels is therefore smaller.
Distortions around or below 1 JND are (by definition) hard to notice by most people — it takes 'eagle eyes' to see such subtle differences.
This would make it impossible to get precise results in the high-fidelity range without requiring a huge amount of participants.
For that reason, another test protocol called Boosted Triplet Comparison is also used in AIC-3.
In the BTC setup, the distorted images are also shown side-by-side, but they are shown at 2x zoom (in other words, they cover a larger
physical area on the screen) and they are flickering at 10 Hz between the distorted image and the source image.
Now observers are asked to select the image with the most noticeable flicker.
The modifications in the experimental setup boost the artifacts, making it easier to notice subtle differences and allowing to
probe images with a fidelity better than the visually lossless threshold.
BTC conditions: 10 Hz flickering, 2x zoom
In the PTC conditions as shown above, it is very hard to distinguish the 1.5 bpp image from the 1.1 bpp image since both images have only very subtle distortions and for
many observers both images are indistinguishable from the source image.
In the BTC conditions however, it does become possible to see flicker in both images (for example around the nose), and observers can see that the lower bitrate image has
a somewhat more noticeable flicker:
JPEG XT, 1.5 bpp, 0.47 JND
JPEG XT, 1.1 bpp, 1.11 JND
JPEG XT, 1.5 bpp, 0.47 JND
JPEG XT, 1.1 bpp, 1.11 JND
The flickering is relatively subtle but most observers will be able to see a stronger flicker effect in the 1.1 bpp image than in the 1.5 bpp image.
Note: you are currently not viewing the HDR images, but images tone mapped to SDR. The flicker may as a result be harder to notice.
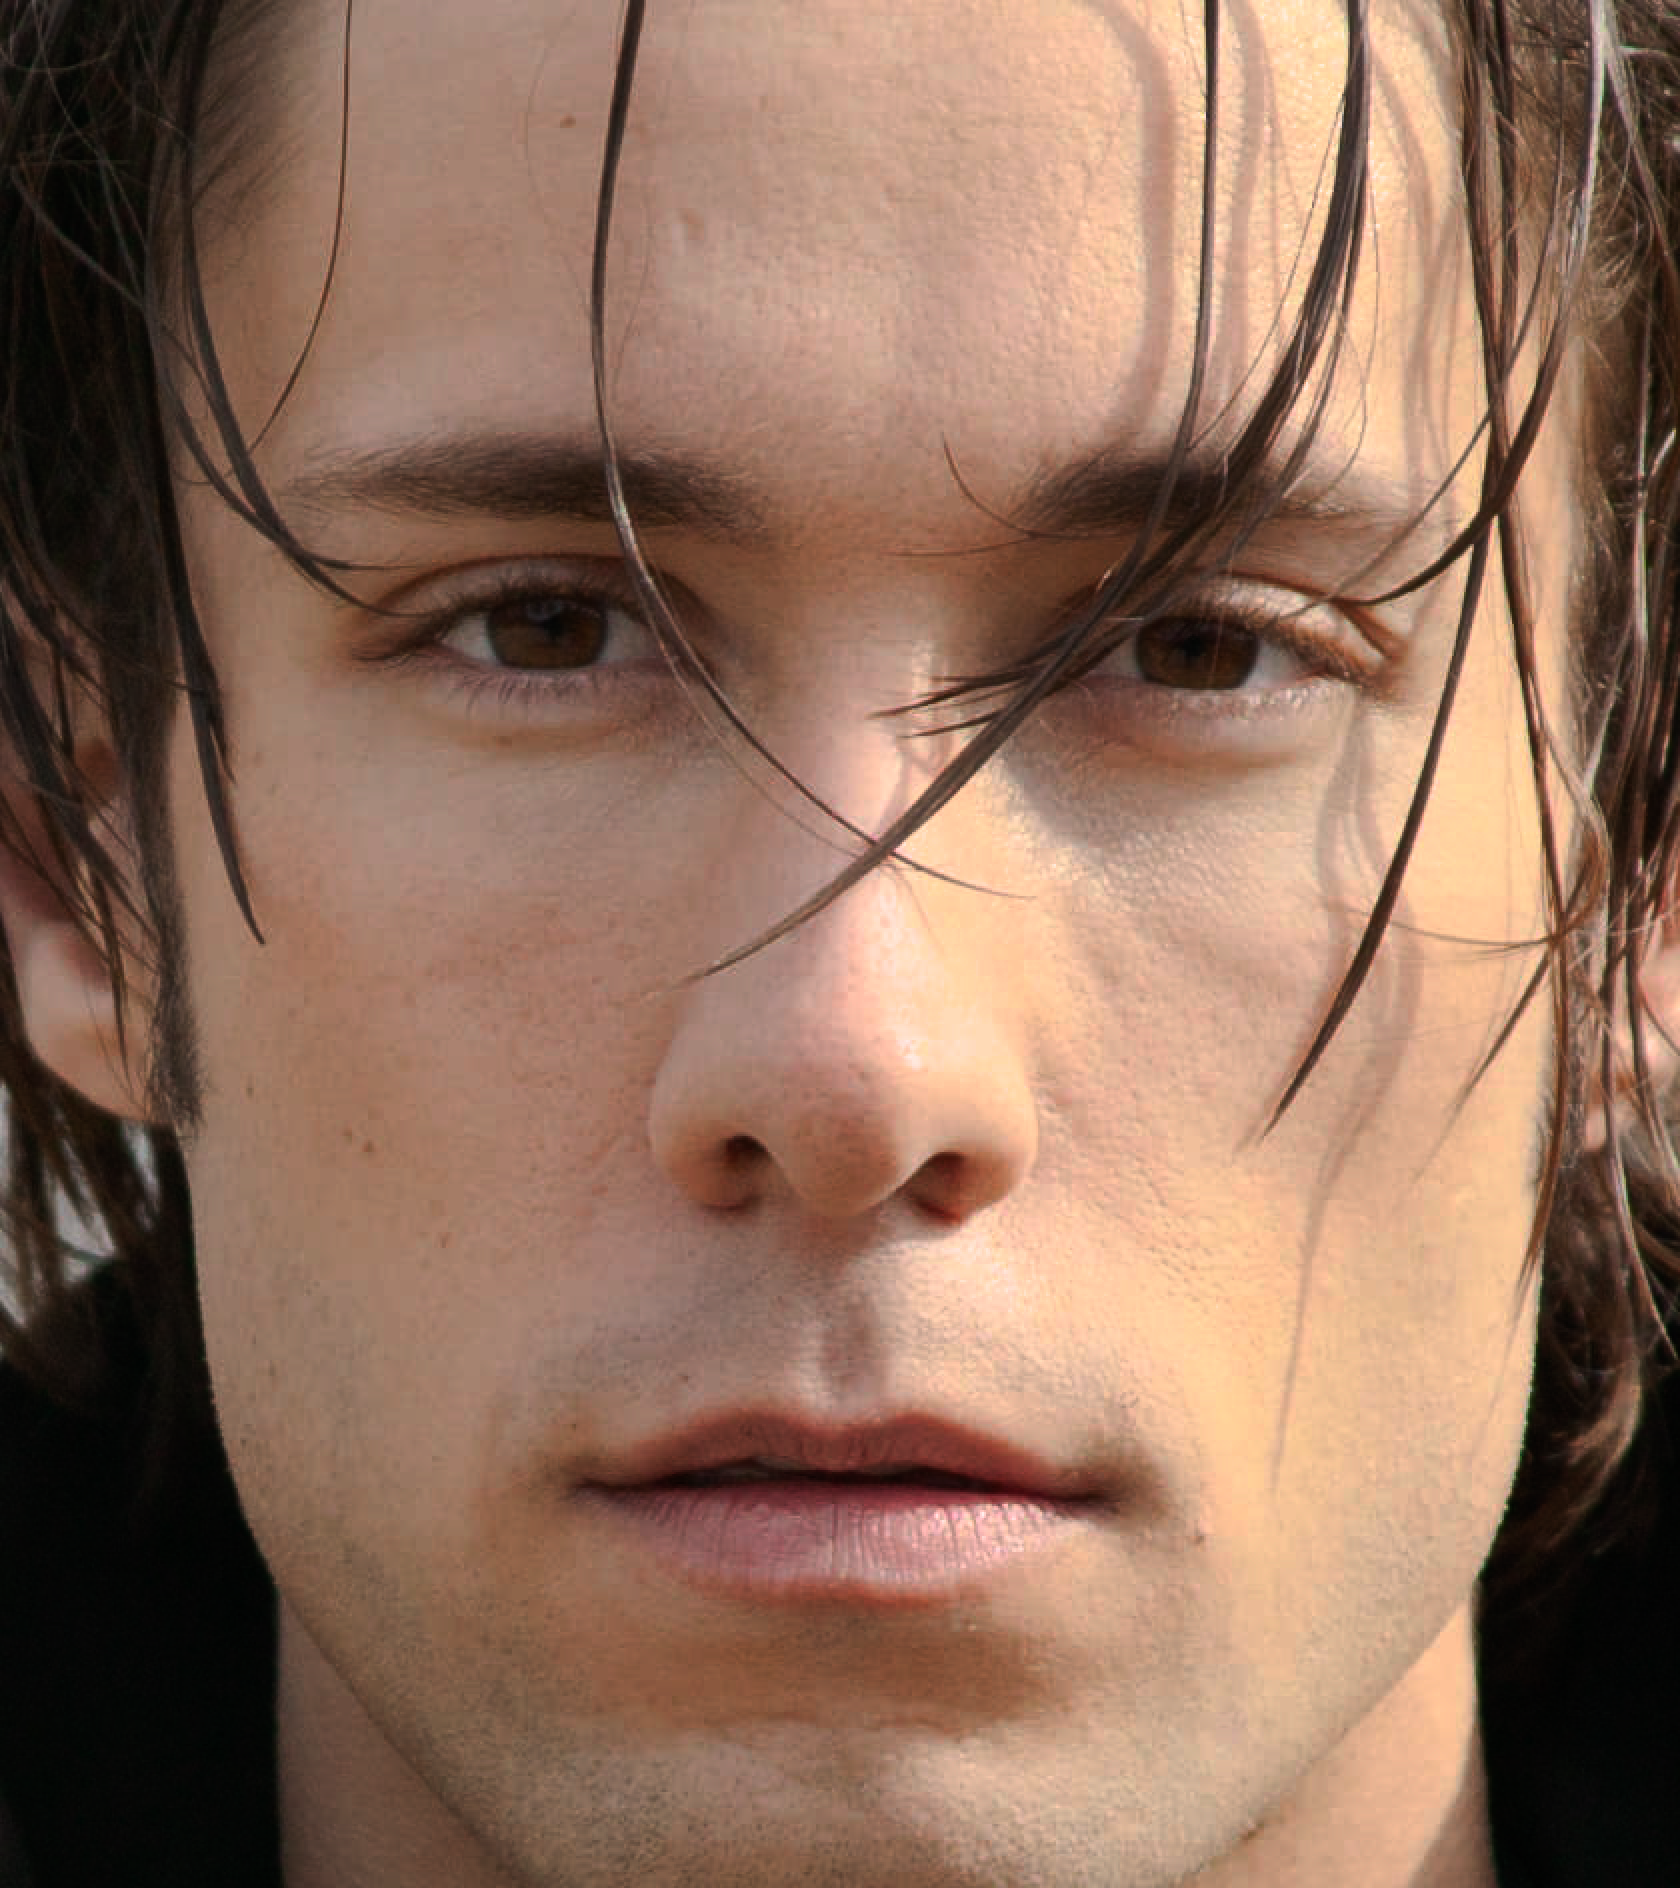
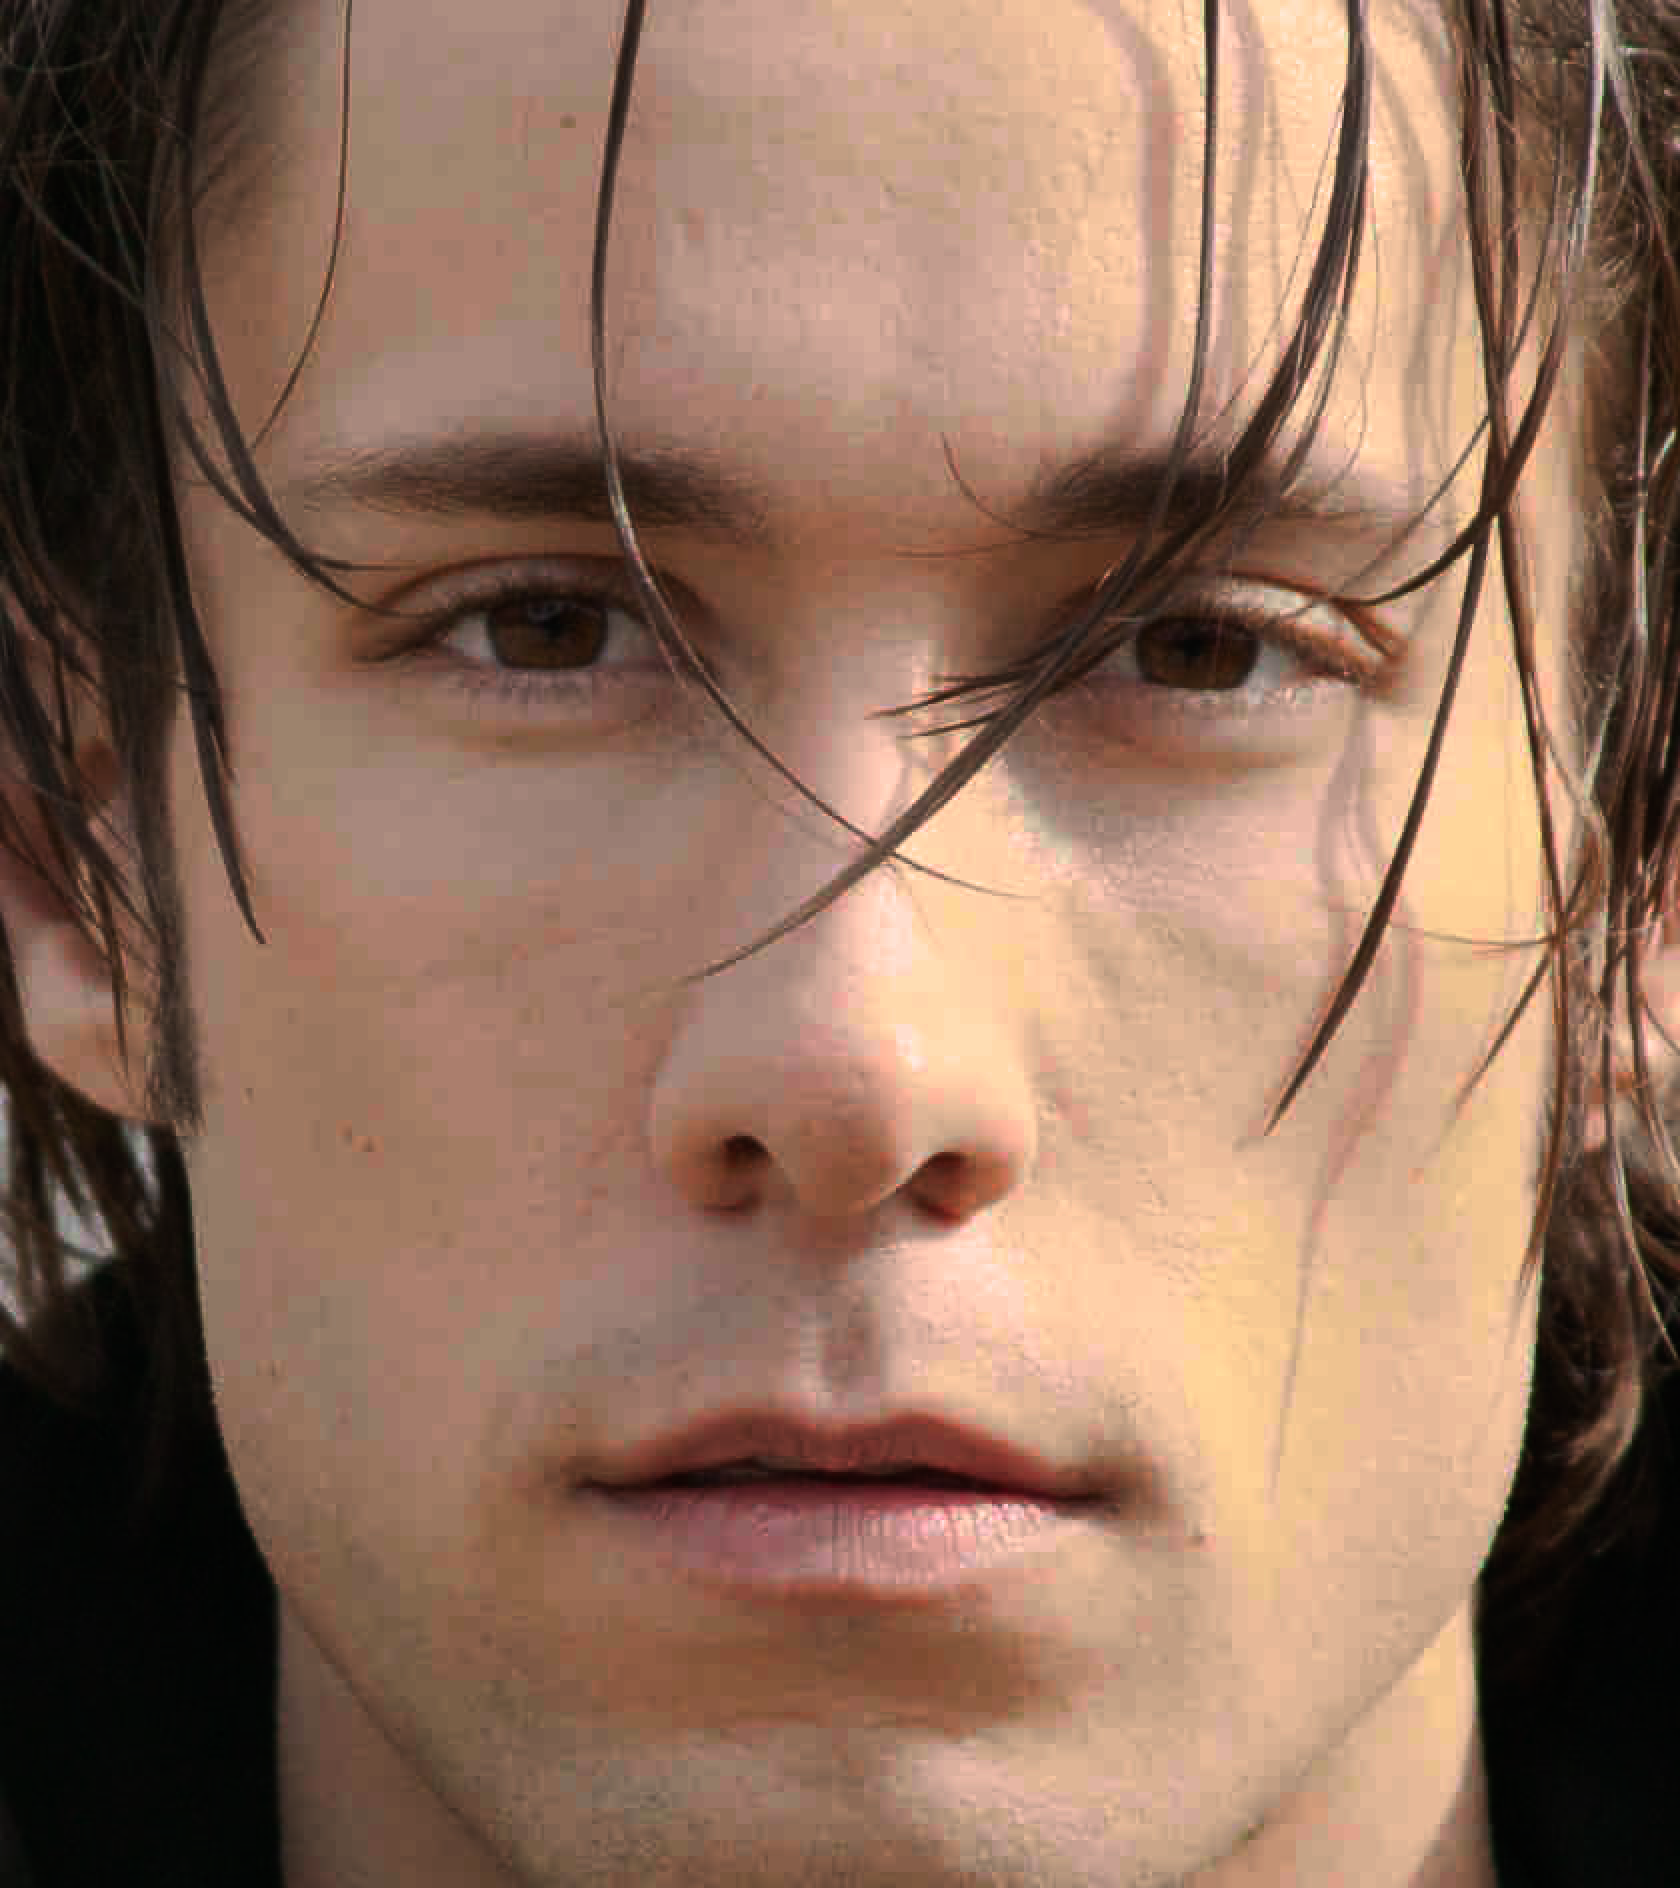
At higher distortion levels, the flicker effect becomes more obvious:
JPEG XT, 0.9 bpp, 1.9 JND
JPEG XT, 0.5 bpp, 5.54 JND
JPEG XT, 0.9 bpp, 1.9 JND
JPEG XT, 0.5 bpp, 5.54 JND
Images
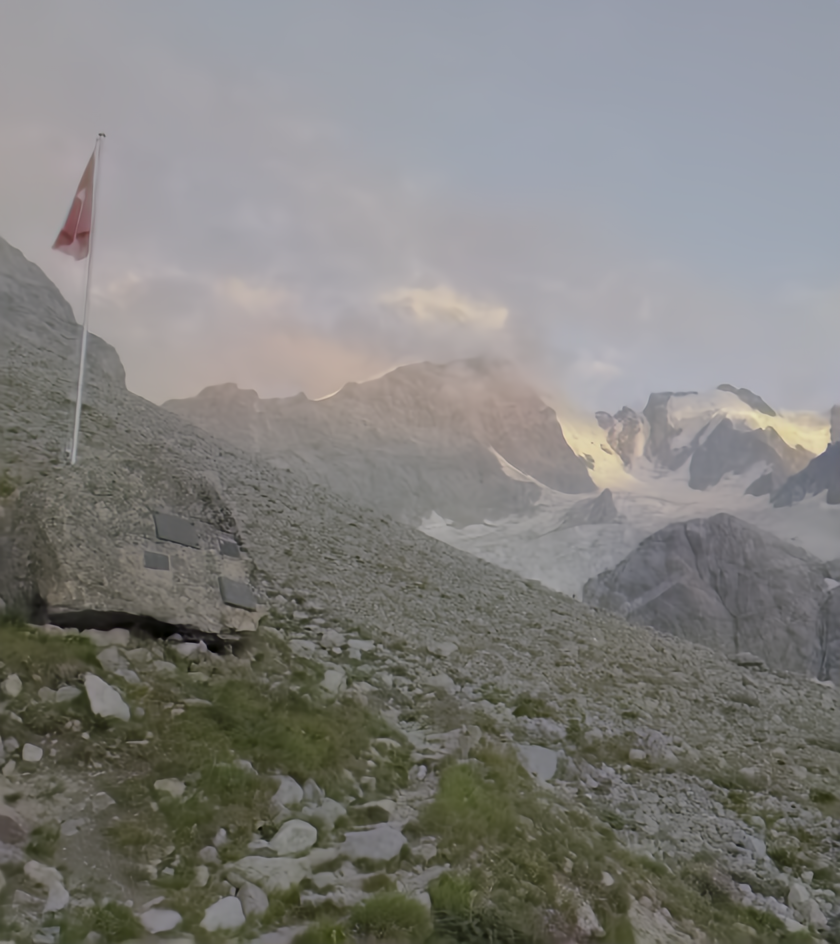
In the experiment, the following five source images were used:
alps-sunset
building
flower
p29-crop
room1
alps-sunset
building
flower
p29-crop
room1
The source images were selected to cover a variety of image content.
They are in the BT.2100PQ color space,
with a bit depth of 10 bits per component (30 bits per pixel).
The images were encoded using four different codecs, at five distortion levels (bitrates):
Bitrates were selected per source image, with AVIF, JPEG AI and JPEG XL using the same set of bitrates
while for JPEG XT higher bitrates were used in order to have a similar quality range for all codecs.
In total, there are 100 distorted images (5 × 4 × 5) in the image set.
For example, for the first source image, these are the four codecs at the highest distortion level (lowest bitrate):
In this experiment, to evaluate the 100 distorted images, 1440 triplet comparison questions were created: all 120 same-codec triplets plus 24 cross-codec triplets per source image,
for both PTC and BTC.
In total, 34,560 responses were collected (17,280 PTC responses and 17,280 BTC responses), 24 per question, by 4 labs in 288 sessions (72 per lab) of 120 questions.
Outlier removal (filtering observers with low accuracy and consistency) disqualified 2 BTC sessions and 10 PTC sessions, leaving 33,120 responses.
As expected, as the difference in distortion level between the two distorted images increases (considering only the same-codec comparisons),
the accuracy of the responses increases while the average time to answer the question goes down.
Also as expected, under PTC conditions it is harder to see differences, so it takes longer and there are more 'not sure' and fewer correct responses:
Test
Measure
Distortion level difference
1
2
3
4
5
BTC
Average time (s)
5.7
4.7
4.1
3.5
3.1
Correct responses
63.7%
86.5%
94.2%
97.7%
98.5%
Incorrect responses
4.7%
1.6%
1.5%
1.2%
1.4%
Not sure
31.6%
11.8%
4.4%
1.2%
0.1%
PTC
Average time (s)
10.8
9.4
8.1
6.8
5.9
Correct responses
56.0%
72.0%
83.0%
92.5%
97.7%
Incorrect responses
8.0%
5.2%
2.8%
2.4%
0.6%
Not sure
35.9%
22.8%
14.3%
5.1%
1.7%
In the AIC-3 methodology, the framework of Thurstonian scaling (Case V) is used to interpret
the detection rates (probability of correct responses) in terms of a JND scale.
Unified reconstruction model
If a JND scale were reconstructed from the BTC responses, the JND values would be higher than those reconstructed from the PTC responses.
For example, 0.5 JND under PTC conditions could very well correspond to 1.5 JND under BTC conditions — it is easier to notice differences in BTC conditions than in
PTC conditions, that's the whole point. Combining both types of experiments is what allows having fine-grained results for very subtle distortions (say, less than 2 JND),
while still using a JND scale that is relevant and based on 'normal' viewing conditions (PTC conditions).
In AIC-3, the assumption is that there exists a boosting function (which may depend on the source and on the codec) that maps the BTC JND scale to the PTC JND scale.
This function effectively expresses how much easier it is to notice artifacts in BTC conditions than in PTC conditions.
The AIC-3 JND scale reconstruction procedure takes the data from both experiments and applies maximum likelihood estimation to fit a unified model
consisting of an exponential rate-distortion function and a quadratic BTC to PTC mapping function per (codec, source) combination.
The end result are functions mapping bitrates (in bits per pixel) to JND units (under PTC conditions).
The resulting reconstructed bitrate-distortion plots are as follows:
The shaded region corresponds to a 95% confidence interval obtained by applying 1000 iterations of bootstrapping.
As you can see in the plots, the confidence intervals are quite narrow, indicating that the AIC-3 methodology indeed does provide precise, fine-grained results.
Objective metrics
Performing subjective experiments takes time and money, so in most practical applications it is necessary to rely on objective metrics instead,
i.e. algorithms that try to predict the perceptual image quality.
Using the JND values from the subjective experiment as ground truth, we can evaluate objective metrics in terms of the correlation between
the scores produced by a metric and the JND values.
The following table lists metrics from best to worst according to
Pearson's linear correlation coefficient (PLCC) and
Spearman's rank correlation coefficient (SRCC):
Not surprisingly, the HDR metrics are generally performing better than the SDR metrics.
In fact, metrics designed for SDR images cannot take HDR images as input; you can give them the pixels as they are (in the BT.2100 PQ space)
but they will misinterpret them as being sRGB. Alternatively you can first tone map the HDR images to SDR and then run the metrics on that,
which generally produces somewhat better results.
Still, SDR metrics cannot really 'see' the images properly, which explains their relatively poor performance.
HDR image
PQ interpreted as sRGB
Tone mapped
Besides the summarized correlation coefficients, it can also be interesting to look at plots of metric scores vs the actual distortion.
In the plots below, a line is shown for every (codec, source) combination:
This reveals that to some degree, all metrics have biases related to the image content — for example, underestimating the quality of the 'flower' image
and overestimating the quality of the 'alps-sunset' or 'building' image — and related to the codec, for example underestimating the quality of JPEG XL images.
Let's dive a bit deeper on this.
Metric bias
Source bias means that metric scores are systematically lower (more pessimistic) or higher (more optimistic) depending on the source image.
This kind of bias is problematic when a metric is used to decide which encoder quality settings (or bitrates) should be used in order to achieve
a consistent image quality across multiple images.
We can visualize the source bias by plotting for every source image the average metric scores, at every JND point averaging the scores for the four codecs
(and only plotting this line in the JND range where ground truth data is available for all four codecs).
For example, if one would encode multiple images using a PSNR target of 41, in the hope that this will result in a consistent image quality,
then the results will be disappointing due to the source bias problem.
PSNR, like most other metrics (with the notable exception of HDR-VDP-2) assigns worse scores to compressed versions of the 'flower' image
than to compressed versions of the 'p29-crop' image.
In other words, the same PSNR value corresponds to a higher actual quality (a lower distortion in JND units) for a compressed 'flower' image
than for a compressed 'p29-crop' image:
Another type of metric bias is codec bias: metric scores are systematically lower or higher depending on the codec used for compression.
This kind of bias is obviously problematic when a metric is used to do codec comparisons or to evaluate new coding tools or encoder tunings.
We can again visualize this bias by plotting average metric scores, this time for every codec, averaging the metric scores for the five images.
For some reason, all metrics are underestimating the quality of JPEG XL images.
As an example, according to PSNR, the image on the left is slightly worse than the one on the right.
The subjective results indicate however that the image on the left is much better than the one on the right.
Even the best available metrics to some extent have this issue of source and/or codec bias.
For that reason, careful subjective experiments are still needed to reliably assess image quality or to evaluate codecs.
The JPEG AIC-3 methodology is very suitable for that since it covers the most relevant quality range for still image compression:
from noticeably distorted (the low end of “web quality”, around 4 JND) all the way up to mathematically lossless, and including
“camera-quality”, which is typically below 1 JND.
What's next? AIC-4!
According to the results above, existing objective metrics such as HDR-VDP-2 do a reasonable job at predicting
the visual fidelity of compressed images.
However there is still room for improvement.
For example, it is worth noting that many of the existing metrics
only consider the luminance component of the images. That makes them effectively colorblind, while color is of course an important aspect of image fidelity.
At the 107th JPEG meeting in April 2025, the
Final Call for Proposals (CfP) on Objective Image Quality Assessment
was launched. This is an invitation to submit new proposed metrics, which will be evaluated by the JPEG committee at the end of 2025.
Then a collaborative phase will start, possibly combining ideas from multiple proposals and leading to a new
standard — JPEG AIC-4 — for objective image quality assessment.
While the main focus will still be on SDR images, it is certainly desirable that the proposed metrics generalize to HDR images as well.
Different types of metrics can be proposed:
Group A: Conventional algorithmic approaches (e.g., based on PSNR-HVS, MS-SSIM, HDR-VDP)
Group B: Learning-based approaches (e.g., LPIPS)
Group C: Multi-method fusion approaches (e.g., VMAF)
The deadline for submission of proposals is at the end of September.
In October, a new test set will be revealed (source images and distorted images), and metric scores are computed on these images.
Meanwhile, subjective quality will be tested using AIC-3, creating the ground truth to compare the metrics against.
At the 110th JPEG meeting in January 2026, the results will be discussed and the collaborative phase will start.
The hopes are that this process will lead to the creation of better objective metrics, which
can in turn enable better perceptual optimization in encoders, and a more consistent and reliable fidelity
in image interchange use cases where lossy compression is used, in particular web delivery.
Acknowledgments
The subjective experiments described in this article were performed in a collaboration between several academic and industry
research groups, brought together in the JPEG committee.
In particular, the lab experiments were performed at
Universität Konstanz and
Technische Universität Ilmenau
in Germany,
École Polytechnique Fédérale de Lausanne (EPFL) in Switzerland,
and Instituto de Telecomunicações (IT) in Portugal.
This research is funded by the DFG (German Research Foundation) – Project ID 496858717, titled “JND-based Perceptual Video Quality Analysis and Modeling”.
D.S. is funded by DFG Project ID 251654672.
References
Standard
    @misc{JPEG_AIC-3,
      author       = {{ISO/IEC DIS 29170-3}},
      title        = {{Information technology — JPEG AIC Assessment of image coding —
                       Part 3: Subjective quality assessment of high-fidelity images}},
      organization = {International Organization for Standardization,
                      International Electrotechnical Commission},
      year         = {2025},
    }
ISO/IEC DIS 29170-3:2025, Information technology — JPEG AIC Assessment of image coding —
Part 3: Subjective quality assessment of high-fidelity images
Papers
    @inproceedings{aic-hdr2025,
      author = {Mohsen Jenadeleh and Jon Sneyers and Davi N. Lazzarotto and Shima Mohammad
                and Dominik Keller and Atanas Boev and António Pinheiro and Thomas Richter
                and Alexander Raake and Touradj Ebrahimi and João Ascenso and Dietmar Saupe},
      title = {Fine-Grained {HDR} Image Quality Assessment
               from Noticeably Distorted to Very High Fidelity},
      booktitle = {17th International Conference on Quality of Multimedia Experience (QoMEX)},
      year = {2025},
    }
Mohsen Jenadeleh, Jon Sneyers, Davi Lazzarotto, Shima Mohammadi, Dominik Keller, Atanas Boev, António Pinheiro, Thomas Richter, Alexander Raake, Touradj Ebrahimi, João Ascenso, and Dietmar Saupe.
“Fine-grained HDR image quality assessment from noticeably distorted to very high fidelity,”
in 17th International Conference on Quality of Multimedia Experience (QoMEX), 2025.
    @inproceedings{aic-sdr-ai,
      author = {Mohsen Jenadeleh and Jon Sneyers and Panqi Jia and Shima Mohammad
                and João Ascenso and Dietmar Saupe},
      title = {Subjective Visual Quality Assessment for
               High-Fidelity Learning-Based Image Compression},
      booktitle = {17th International Conference on Quality of Multimedia Experience (QoMEX)},
      year = {2025},
    }
Mohsen Jenadeleh, Jon Sneyers, Panqi Jia, Shima Mohammadi, João Ascenso, and Dietmar Saupe.
“Subjective Visual Quality Assessment for High-Fidelity Learning-Based Image Compression”
in 17th International Conference on Quality of Multimedia Experience (QoMEX), 2025.
arXiv:2504.06301
    @inproceedings{dcc_aic3,
      author = {Michela Testolina and Mohsen Jenadeleh and Shima Mohammadi and Shaolin Su
                and João Ascenso and Touradj Ebrahimi and Jon Sneyers and Dietmar Saupe},
      title = {Fine-grained Subjective Visual Quality Assessment
               for High-fidelity Compressed Images},
      booktitle = {Data Compression Conference (DCC)},
      year = {2025},
      organization = {IEEE}
    }
Michela Testolina, Mohsen Jenadeleh, Shima Mohammadi, Shaolin Su, João Ascenso, Touradj Ebrahimi, Jon Sneyers, and Dietmar Saupe.
“Fine-grained subjective visual quality assessment for high-fidelity compressed images,”
Data Compression Conference (DCC), 2025.
arXiv:2410.09501
    @inproceedings{testolina2022towards,
      title = {Towards {JPEG AIC Part 3}:
               Visual Quality Assessment of High to Visually-lossless Image Coding},
      author = {Michela Testolina and Evgeniy Upenik and Jon Sneyers and Touradj Ebrahimi},
      booktitle = {Applications of Digital Image Processing XLV},
      volume = {12226},
      pages = {90--98},
      year = {2022},
      organization = {SPIE}
    }
Michela Testolina, Evgeniy Upenik, Jon Sneyers, and Touradj Ebrahimi.
“Towards JPEG AIC part 3: visual quality assessment of high to visually-lossless image coding,”
Applications of Digital Image Processing XLV, vol. 12226, pp. 90-98. SPIE, 2022.


.pdf)