
With the growing adoption of the Internet of Things (IoT), it’s fun to build apps with IoT devices like Arduinos or Raspberry Pis. This tutorial shows you how to implement an interesting Arduino project, starting with using a photoresistor sensor to generate pictures in a JavaScript app. You’ll then upload them to Cloudinary, where you can monitor the images for changes in the input from the sensor.
The Arduino app you’ll build applies to several use cases, i.e., you could—
- Swap out the photoresistor sensor for other sensors or motors.
- Create an app that displays the temperature changes in your house throughout the day.
- Build complex projects with the sensor data, like having a motor close your blinds if the temperature rises above a certain level.
Even though gadgets geared for similar purposes are readily available at retail outlets, stepping through this tutorial will earn you hands-on experience with hardware and sharpen your JavaScript skills. Do give it a whirl.
For this project, you’ll need the following hardware along with electrical power:
- An Arduino Uno microcontroller board
- This sensor
- A breadboard
- Wires
- Download the Arduino IDE.
- Hook up the IDE to your computer and then copy and paste into the IDE the Firmata code, which enables interactions with JavaScript apps.
- In the Arduino IDE, choose Sketch > Upload to upload the Firmata code to your Arduino board.
Make a note of the number of the port your board is on. You’ll need that number for setting up the app’s server later.
To activate reading of data into your app, connect the sensor to the board, like this:
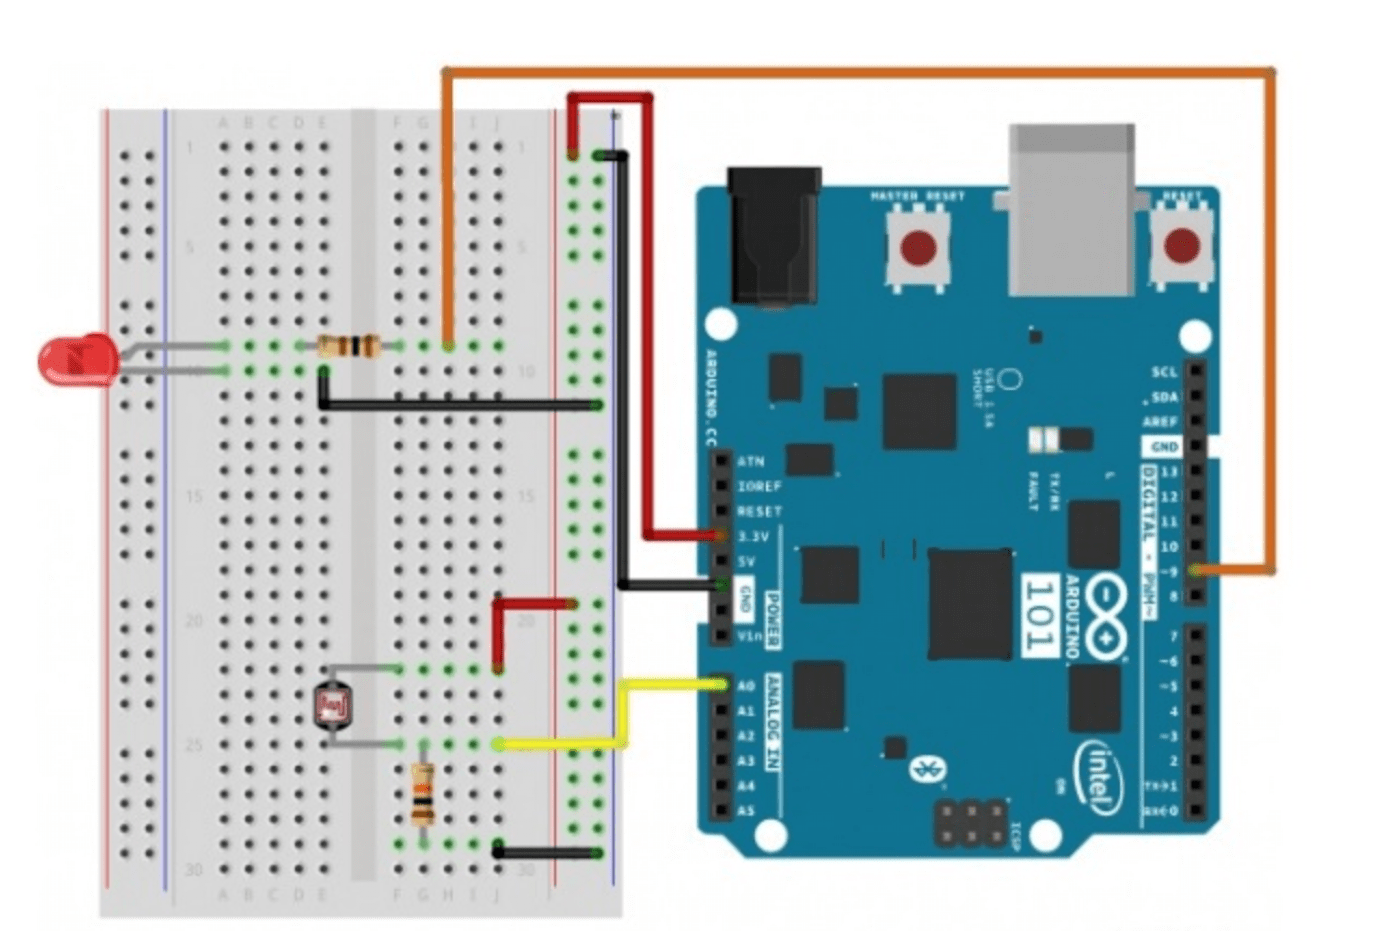
As long as the connections are correct, feel free to organize the wires however you wish.
Now build a Node server for fetching data from the sensor and a front end for display. Instead of a framework, plain old .html, .css, and .js files would suffice.
In a folder, create a file called server.js to house the code that sends the data from the sensor to the front end. Do the following:
- Run these commands in a terminal:
$ npm i express cors johnny-five
The `express` and `cors` libraries are for creating the REST endpoint from which the front end collects the sensor data. The [`johnny-five` library](http://johnny-five.io/), which facilitates interactions with the Arduino board, is a remarkably useful package. Have a look if you're interested in exploring IoT and in developing JavaScript apps.
-
In the
server.jsfile, add the code below to set up the app. Be sure to update theboardvariable to reflect the port address of your Arduino board. That address is in or similar to one of these formats:/dev/ttyUSB#,/dev/tty.usbmodem####, orCOM#.const five = require("johnny-five"); const cors = require('cors'); const express = require('express'); const PORT = process.env.PORT || 3000; const app = express(); app.use(cors()); app.use(express.json()); app.use(express.urlencoded({ extended: false })); const board = new five.Board({ port: "/dev/ttyUSB3" }); let photoresistor = {}Code language: PHP (php)
The above code imports the packages you just installed and added variables.
To pick up the sensor data, connect to the correct pin on the board in your code by placing these lines below the section on imports and variable declarations:
board.on("ready", function() {
// Create a photoresistor hardware instance.
    photoresistor = new five.Sensor({
        pin: "A2",
        freq: 250
    });

    // Inject the sensor hardware into
    // the Repl instance's context and
    // allow direct command-line-access
    board.repl.inject({
        pot: photoresistor
    });
});
Code language: JavaScript (javascript)
Subsequently, when ready to send you data following a sensor reading, the app inputs the data at pin A2. To change a value, e.g., the frequency, reconfigure the sensor in the command line.
Next, add the endpoint from which to send the data to the front end with this code, placing it below the board method:
app.get('/api/getSensorData', (req, res) => {
    let data = {}
    // "data" gets the current reading from the photoresistor
    photoresistor.on("data", function() {
        console.log(this.value);
        data = this.value
    });

   res.send({
       message: data
   });
});

app.listen(PORT, () => {
 console.log(`endpoints running on port ${PORT}`);
});
Code language: JavaScript (javascript)
The above code does the following:
-
Get the photoresistor data and, in response to the
getSensorDataendpoint, send it to both the console and the front end. -
Start the server with the
app.listenmethod. For thePORTvariable, specify the port number of your choice in a.envfile or let the number default to 3000.
As previously mentioned, you’ll leverage packages instead of a framework to build the front end. Here’s what to do:
-
In your project folder, create a subfolder called
clientin which to create two files:client.htmlandclient.js. Want to tinker with styles? Add code to aclient.cssfile. -
Import packages in skeleton HTML by adding the code below to the
client.htmlfile:
<!DOCTYPE html>
<html>
   <head>
       <link rel="stylesheet" href="./client.css">
       <script src="https://cdn.jsdelivr.net/npm/chart.js@3.7.0/dist/chart.min.js"></script>
       <script src="https://cdnjs.cloudflare.com/ajax/libs/html-to-image/1.9.0/html-to-image.js" integrity="sha512-8GQQGLSN+MYJfxnTNZm8HPIXz9TkAMeRcadyQO/oFsk+OAHOH7uTz5dAafi1ADICwul44a3JpV2vsolsjVeVGg==" crossorigin="anonymous" referrerpolicy="no-referrer"></script>
       <title>Real World Visuals</title>
   </head>
   <body>
       <header>This reading originates directly from the sensor data.</header>
       <main>
           <canvas id="sensorVisual" width="500"></canvas>
       </main>
       <script src="./client.js"></script>
   </body>
</html>
Code language: HTML, XML (xml)
Optionally, import the stylesheet and the ChartJS package with HTML elements in the above snippet. You would then create a visual image from the data collected over time. Afterwards, take a picture with the html-to-image package and upload the picture to Cloudinary.
Now create the client.js file with canvas and <script> elements:
-
Add this code to the
client.jsfile to gather the sensor data from the endpoint you built earlier:window.onload = async () => { const ctx = document.getElementById('sensorVisual').getContext('2d') let data = await fetch('https://localhost:3000/api/getSensorData') }Code language: JavaScript (javascript) -
Create a chart to display the sensor data by placing this code below the request in step 1:
const chart = new Chart(ctx, { type: 'bar', data: { labels: data.x, datasets: [{ label: 'sensor', data: data.y, borderWidth: 1 }] }, options: { scales: { y: { beginAtZero: true } } } })Code language: JavaScript (javascript)
By way of explanation:
- The
Chartobject is a bar graph that conforms with the data format and that attaches to thecanvaselement. The data can also be displayed in other types of charts. - The
dataproperties denote the data values from the back end for the chart. To accurately scale the graph, theyaxis starts at zero.
Now open the client.html file in your browser for the graph:

Finally, place this code below the snippet for the Chart object to add the canvas element, convert the data to an image, and upload the image to your Cloudinary account:
Be sure to replace the variable cloudName with the value of your account’s cloudName for the correct location.
const canvas = document.getElementById('sensorVisual')

const dataUrl = await toPng(canvas, { cacheBust: true })

const uploadApi = `https://api.cloudinary.com/v1_1/${cloudName}/image/upload`

const formData = new FormData()
formData.append('file', dataUrl)
formData.append('upload_preset', 'cwt1qiwn')

await fetch(uploadApi, {
    method: 'POST',
    body: formData,
})
Code language: JavaScript (javascript)
From here on, loading client.html leads to a photoshoot of the data from the sensor connected to your Arduino board.
The final code for the app resides in the iot-image-generator page on GitHub. For troubleshooting help, see the documentation for Arduino and details of the Boards class on the Johnny-Five community site.
Sensors in various industries furnish data in a similar manner. Harnessing the data and passing it through a web app could offer fascinating insight so keep that idea and process in mind.