
Sometimes you need to generate reports that show users certain metrics around what they do in an app. A report can include anything from images to specific user data and they can give your users meaningful ways to monitor their behavior.
That’s why we’re going to make some custom user reports with Redwood. This little app will let users see their information in a table and then print it to a PDF if they need it offline. They’ll get a product list with quantities and prices included with pictures. We’ll be hosting our images on Cloudinary so we don’t have to worry about keeping them in a local directory.
In a terminal, run the following command to create a new Redwood app.
yarn create redwood-app user-reports
This will generate all of the files we need to create a robust front-end and back-end connected to a database. The back-end is contained in the api folder and the front-end is in the web folder.
We’ll start by making the model for this app. It’s usually a good idea to have the business model defined for an app before jumping into very much code.
The first thing we’ll do is update the connection string to our database instance. We’re using a local Postgres instance to handle our operations. So we need to update the .env file.
You can uncomment the DATABASE_URL line and update it to the connection string for your instance. Here’s an example of what one might look like.
DATABASE_URL=postgres://postgres:admin@localhost:5432/user_reports
Code language: JavaScript (javascript)
If you need to set up a local instance of Postgres to get your connection string, check out their docs.
Next, go to api > db and open up the schema.prisma file. We need to update the provider to postgresql since that’s the database we’re working with. Now we can delete the example model and replace it with our own.
model User {
  id       Int       @id @default(autoincrement())
  email    String    @unique
  name     String
  products Product[]
}

model Product {
  id       Int    @id @default(autoincrement())
  name     String
  imageUrl String
  price    Float
  quantity Int
  User     User?  @relation(fields: [userId], references: [id])
  userId   Int?
}
Code language: JavaScript (javascript)
There is one foreign key relationship between these two models. One user can have multiple products associated with it. That’s why we have the userId and User on the Product table. It’s the reference to the User table.
With the models in place, we can run a database migration.
yarn rw prisma migrate dev
When you have relations in your models, it’s usually a good idea to add default values to your database to prevent any errors in the app when you start it. You’ll see a lot of production database seed data like dropdown options, user roles, or initial users.
In the seed.js file, in api > db, you can delete all of the commented out code in the main function because we’ll be adding our own calls.
await db.user.create({
  data: { name: 'Mochi', email: 'mochi@test.com' },
})

await db.product.create({
  data: {
    name: 'Jugs',
    imageUrl: 'example.com/jhon.png',
    price: 7.88,
    quality: 25,
    userId: 1,
  },
})
Code language: CSS (css)
Now run this command to seed the database.
yarn rw prisma db seed
With the database ready to go, we can move to the back-end and front-end.
Redwood does a lot of work for us once the model has been migrated. We can get the CRUD for both the front-end and back-end with these two commands.
yarn rw g scaffold user
yarn rw g scaffold product
These two let us add users and products in this app. That way we can add new products to different users and create those custom reports for them.
You’ll find all of the generated code for the GraphQL server in the api > src folder. The types and resolvers are in the graphql and services folders respectively. All of the front-end code will be in web > src. There are quite a few new files and folders for the front-end, so we’re going to focus on just one.
To see what these new pages look like, go ahead and run the app with:
yarn rw dev
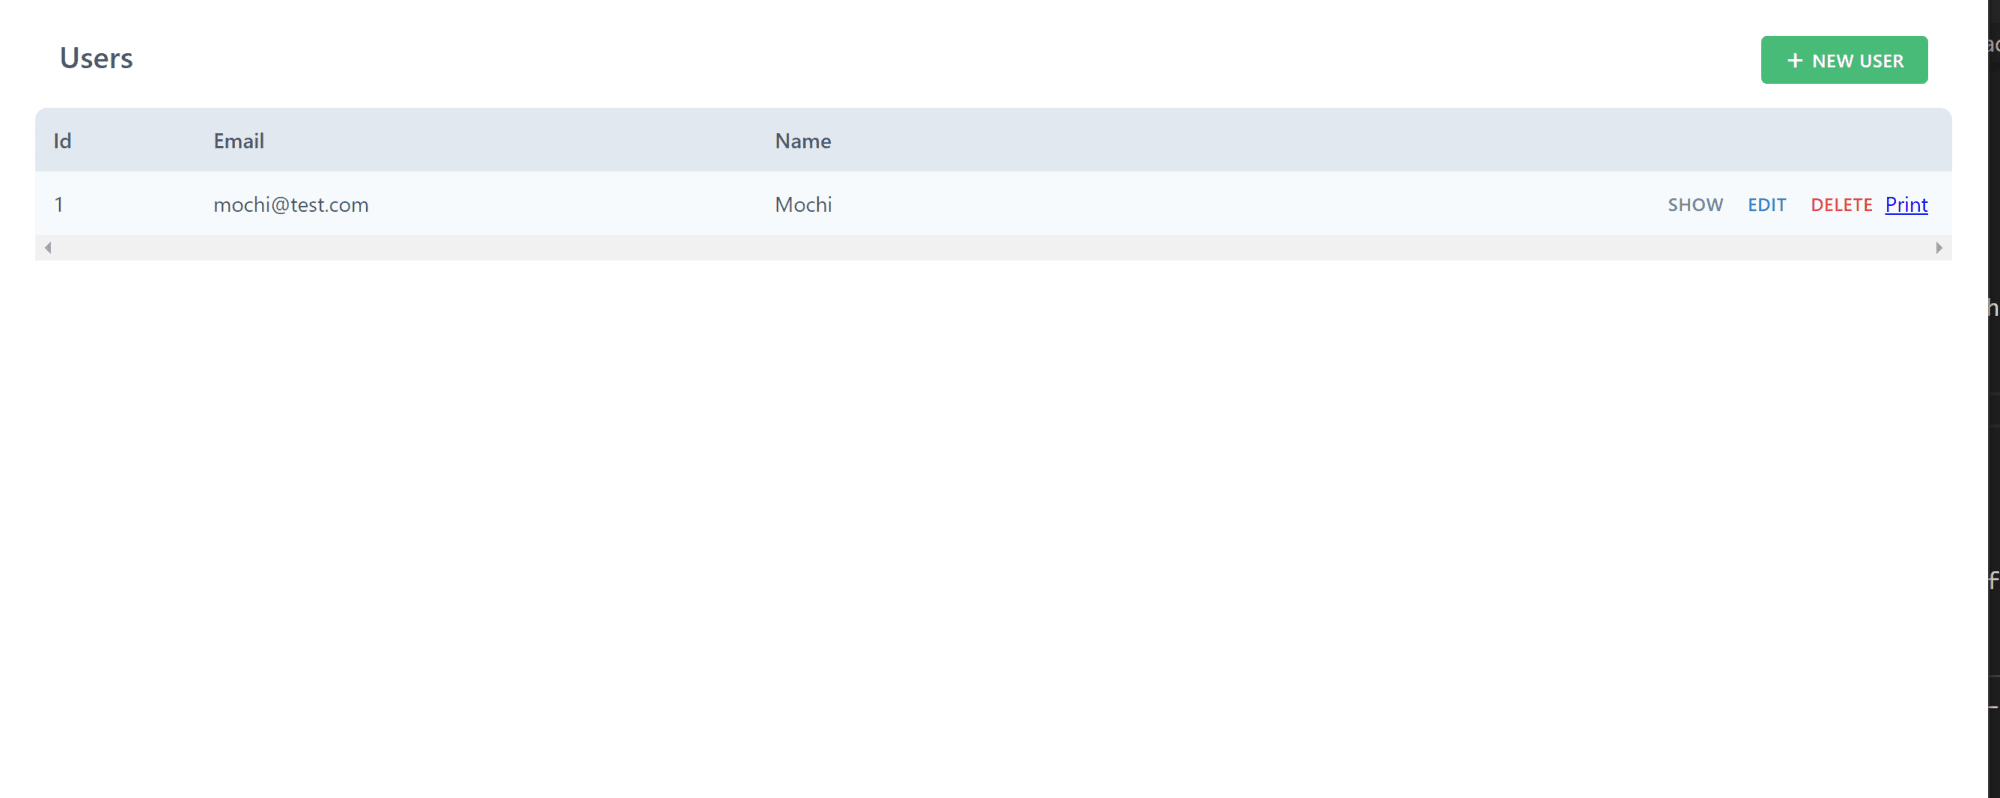
Then go to localhost:8910/users in the browser. You should see something like this.
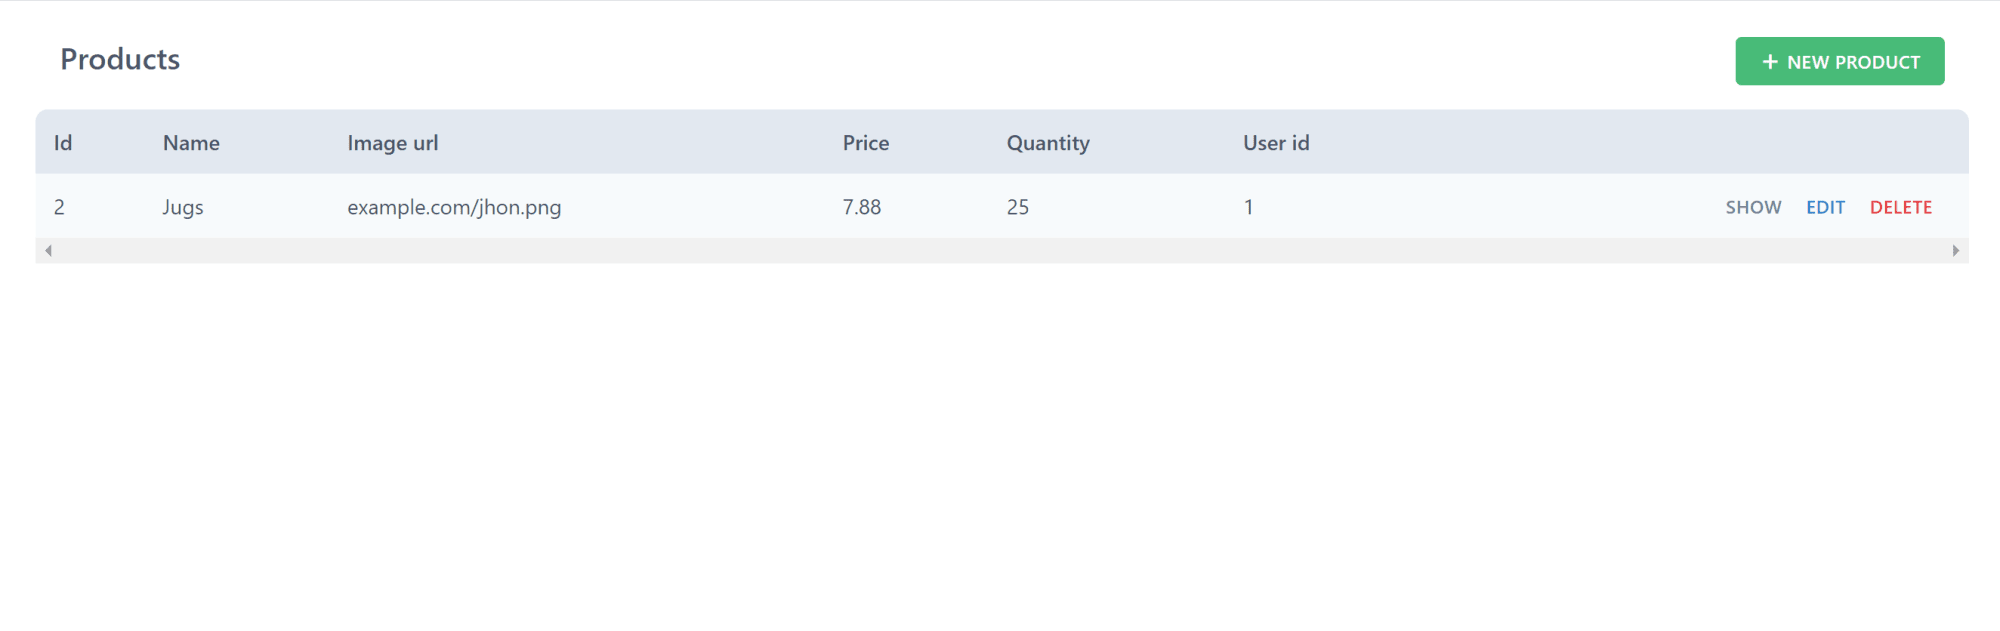
If you go to localhost:8910/products, you’ll see something like this.
Since we’re going to host our images on Cloudinary, we need to upload a few images. To that, create or login to your Cloudinary account.
When you log in, you’ll be taken to the dashboard. At the top, navigate to the “Media Library”. This is where you can upload images and videos. It’ll look similar to this.

Use the “Upload” button to upload some product images or any other images you like. None of the images I’ll be using are for any type of product.
In web > src > components > User > Users folder, we’ll open the Users.js file because this is where we’ll add the report and a button that will download it for users.
First thing we need to do is add the react-pdf package to the web directory. So in the web directory in your terminal, run:
yarn add @react-pdf/renderer
Code language: CSS (css)
Then we’ll need to import that some components from the package at the top of Users.js, like this:
import {
  Page,
  Image,
  Text,
  View,
  Document,
  PDFDownloadLink,
  StyleSheet,
} from '@react-pdf/renderer'
Code language: JavaScript (javascript)
Now that we have all of the components imported, we’ll start by adding the styles for the report pages. So right above the UsersList component, add this:
const styles = StyleSheet.create({
  page: {
    flexDirection: 'row',
    backgroundColor: '#E4E4E4',
  },
  section: {
    margin: 10,
    padding: 10,
    flexGrow: 1,
  },
})
Code language: JavaScript (javascript)
It won’t be the fanciest looking report, but feel free to play with the styles as you see fit. Now we should make the actual report. For now, we’ll just show the user’s name. Right below the styles we just created, add the following:
const UserReport = ({ user }) => (
  <Document>
    <Page size="A4" style={styles.page}>
      <View style={styles.section}>
        <Text>Name: {user.name}</Text>
      </View>
    </Page>
  </Document>
)
Code language: JavaScript (javascript)
This makes the content that will show in the pdf. We’ll expand this in a bit to return all of the product info associated with a user. First, let’s go ahead and make our download button.
People with access to this table should be able to download a pdf for any of the users on the table. So we’re going to add a “Download” button right after the “Delete” button in the table row for each user.
To do that, add the following code below the last <a> element in the UsersList component.
<PDFDownloadLink
  document={<UserReport user={user} />}
  fileName={`user_report_${user.id}`}
>
  {({ blob, url, loading, error }) =>
    loading ? 'Generating report...' : 'Download'
  }
</PDFDownloadLink>
Code language: PHP (php)
We’re using the PDFDownloadLink component to handle the actual download. We specify the document component we want to use which is UserReport and we’re passing in the user data for that row. Then we handle the pdf’s download state inside the component so that we know if the pdf is still being generated.
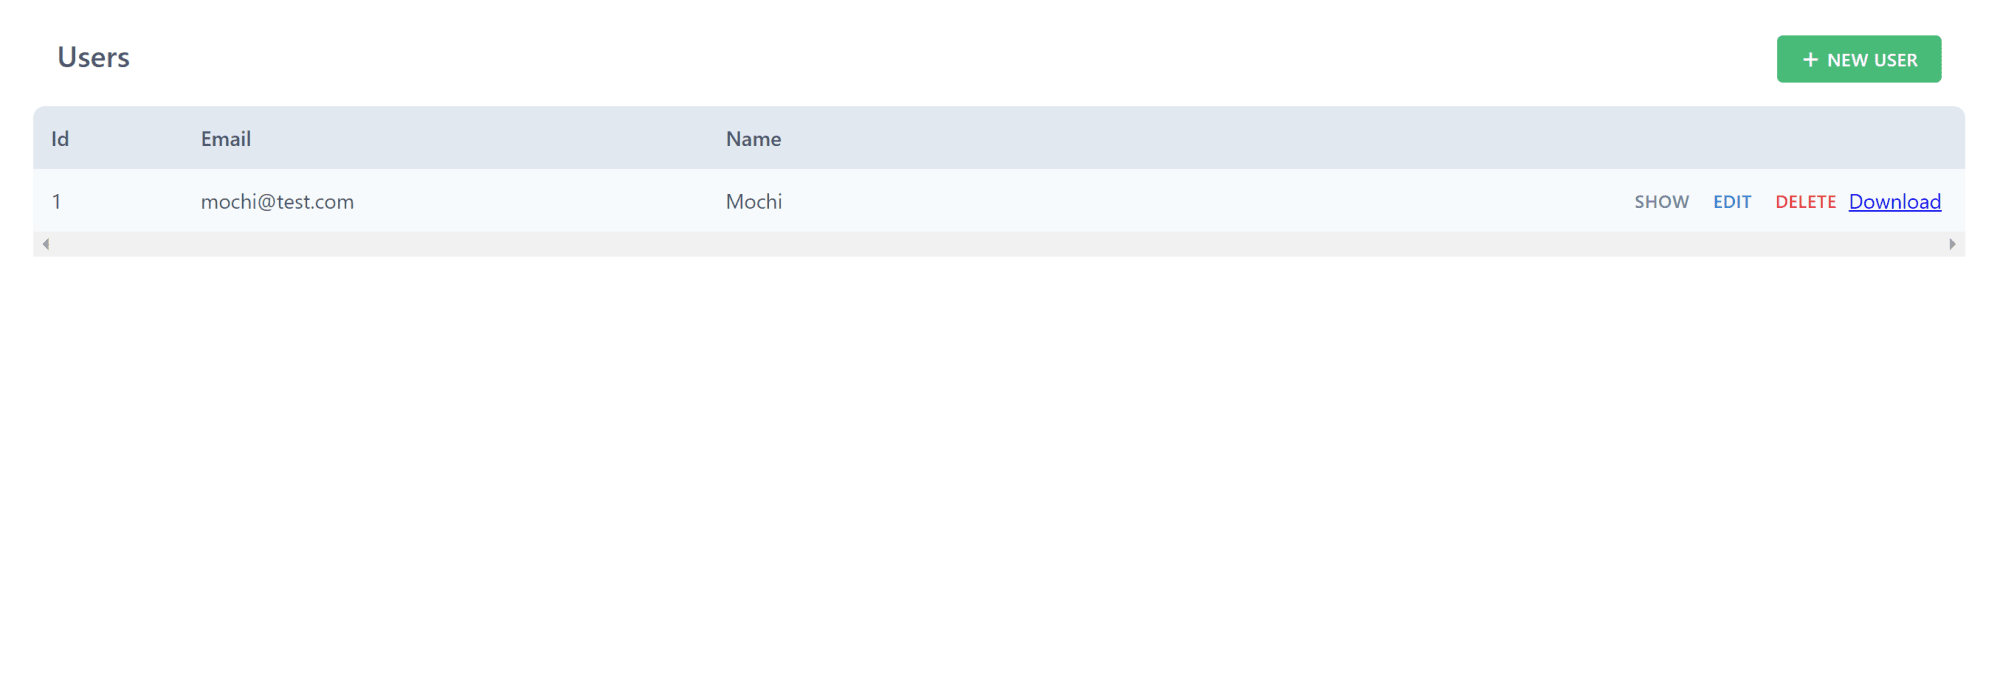
Now when you run the project in the browser, you’ll see a new button on the row.
Now that we have the front-end downloading a PDF, we need to create the resolver that will return the products associated with a user. Open users.js in api > src > services > users. This is where we’ll add the query to get a user’s products. Right below the deleteUser mutation, add this query:
export const getUserProducts = ({ id }) => {
  return db.product.findMany({
    where: {
      userId: id,
    },
  })
}
Code language: JavaScript (javascript)
This queries the product table for any products that have the user ID we pass in. We also need to add a type to users.sdl.js in api > src > graphql. This will make the query available on our server. Let’s add the new type below the user query definition.
Note: The users.js and users.sdl.js files were automatically generated when we ran the scaffold command. We’re just adding these couple of things to them.
getUserProducts(id: Int!): [Product]
Code language: CSS (css)
That’s all for the back-end! All that’s left is using this query on the front-end and a quick update to the document we made.
We’ll need to update Users.js in the web > src > User > Users folder. The first thing we’ll do is import the useQuery hook. You can add this to the existing import from ‘@redwoodjs/web’.
import { useMutation, useQuery } from '@redwoodjs/web'
Code language: JavaScript (javascript)
With this import, we can add the query we need to get our data. We’ll do that right below the DELETE_USER_MUTATION.
const GET_USER_PRODUCTS = gql`
  query GetUserProductsQuery($id: Int!) {
    getUserProducts(id: $id) {
      quantity
      name
      imageUrl
      price
    }
  }
`
Code language: PHP (php)
This will return an array of products associated with the given user ID. The next thing we’ll do is update the UserReport so that we can show the product data. Note that we changed the name of the prop we’re passing in.
const UserReport = ({ products }) => (
  <Document>
    {products.map((product) => (
      <Page size="A4" style={styles.page}>
        <View style={styles.section}>
          <Text>Name: {product.name}</Text>
          <Text>Price: {product.price}</Text>
          <Text>Quantity: {product.quantity}</Text>
        </View>
        <View style={styles.section}>
          <Image src={product.imageUrl} />
        </View>
      </Page>
    ))}
  </Document>
)
Code language: JavaScript (javascript)
We’re in the last steps now! All that’s left is to fetch the product data for each user row and generate a report that will be downloadable. Inside of the <tbody>, where we map over the users, add this bit of code above the return statement.
const { loading, data } = useQuery(GET_USER_PRODUCTS, {
  variables: { id: user.id },
})
if (loading) {
  return <div>...</div>
}
Code language: JavaScript (javascript)
This is how we will get the product data to pass into our reports. We add a check to see if the data is still loading or else it return prematurely and the app will crash because there’s no data to use.
We need to update the prop we pass to the UserReport in the “Download” button.
<UserReport products={data.getUserProducts} />
Code language: HTML, XML (xml)
Now when you run your app and click the download button for your user, you should get a PDF that displays all of the products you create for them!
You can check out the finished code in this repo on GitHub in the user-reports folder. You can also see the front-end code in this Code Sandbox.
Giving users an easy way to see their data is a common task. Generating dynamic PDFs in JavaScript is a useful skill to have in your toolbox, so feel free to look at approaches that may be better for performance.