According to Wikipedia, a bar chart is a chart that presents categorical data using rectangular bars with heights or lengths proportional to the values that they represent. On one axis of the chart are the categories under comparison, while on the other is the measured value.
At the end of the article, we will have understood how to implement a bar chart into our Nuxt.js application.
To follow along with the article, a basic understanding of Nuxt.js is required.
This article’s source code is available on GitHub:
https://github.com/folucode/nuxtjs-barchart
The completed project is on CodeSandbox. Fork it and run the code.
Node has to be installed on our computer to set up the Nuxt.js application. To install Node, we’ll head over to the Nodejs website and follow the instructions to install the software compatible with our operating system.
We can verify the Node.js installation by running the command below:
node -v
v16.10.0 //node version installed
To create the Nuxt.js app, run the command below. It will automatically set up a boilerplate Nuxt.js app.
$ npm init nuxt-app <project-name>
# or
$ yarn create nuxt-app <project-name>

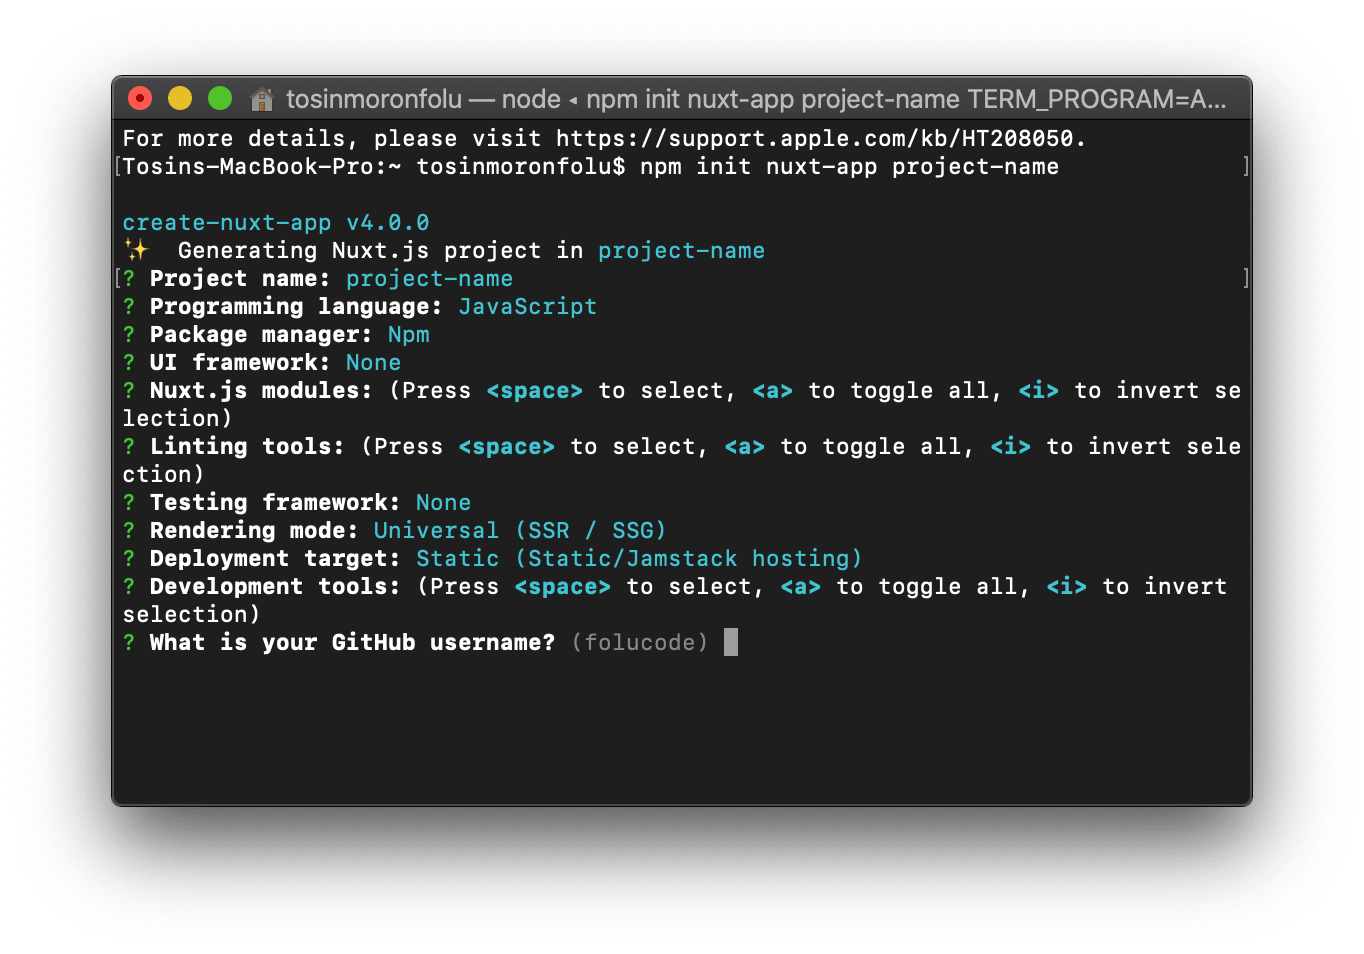
After running the command, we see different options to configure our Nuxt.js app. Make sure to choose the options listed in the image above for each prompt.
- For
Nuxt.js modules, we’ll pickAxiosas our option. - For
Linting tools, we’ll pickPrettieras our option. - For
development tools, we’ll pickjsconfig.jsonas our option. - For
GitHub username, make sure to useGitHubusername.
After the installation is complete, change the directory to the app we just created:
cd <app-name>
Run npm run dev or yarn dev to start the development server on http://localhost:3000.

We’ll be using an npm package called [Chart.js](https://www.npmjs.com/package/chart.js) to create the bar chart in our application. Install it using the command below:
$ npm i chart.js
After installing the package, we’ll create a new file called BarChart.vue in the components folder and then copy-paste the code below:
<template>
    <div>
        <canvas id="bar-chart"></canvas>
    </div>
</template>
<script>
import { Chart, registerables } from 'chart.js';

export default {
    name: "BarChart",
};
</script>
In the code above, we create a Nuxt.js template and a parent div. Inside the parent div, we create a canvas element that will later be used to render our chart. Then we import the Chart.js package and export the BarChart component.
Next, we create a new folder called data at the root of our app, and inside it, create a file called chart-data.js. Inside the chart-data.js, paste the code below in it:
const barChartData = {
  type: "bar",
  data: {
    labels: ["Lions", "Monkeys", "Zebras", "Eagles", "Horses"],
    datasets: [
      {
        label: "Dataset 1",
        data: [12, 19, 3, 2, 3],
        backgroundColor: [
          "rgba(255, 99, 132, 0.2)",
          "rgba(54, 162, 235, 0.2)",
          "rgba(255, 206, 86, 0.2)",
          "rgba(75, 192, 192, 0.2)",
          "rgba(153, 102, 255, 0.2)",
          "rgba(255, 159, 64, 0.2)",
        ],
        borderColor: [
          "rgba(255, 99, 132, 1)",
          "rgba(54, 162, 235, 1)",
          "rgba(255, 206, 86, 1)",
          "rgba(75, 192, 192, 1)",
          "rgba(153, 102, 255, 1)",
          "rgba(255, 159, 64, 1)",
        ],
        borderWidth: 1,
      },
    ],
  },
  options: {
    responsive: true,
    plugins: {
      legend: {
        position: "top",
      },
      title: {
        display: true,
        text: "Number of animals in the zoo",
      },
    },
  },
};

export default barChartData;
In the code above:
- Chart type is set to
barin the configuration object - Configurations are set in the
dataproperty and contains charts’ labels, datasets used to define specific data to be shown, and background color to distinguish one dataset from another, also contains a border-color and border width property to set the border’s thickness -
optionsobject to define the responsiveness of the chart, positioning, and title
To render our bar chart, we will change the content of the BarChart.vue component and index.vue page.
-
First, in the
BarChart.vuecomponent, we’ll import thebarChartDataobject from thechart-datafile and then export thedataproperty, which returns thebarChartDataobject so we can use it in our component. -
Then export the
mountedlifecycle method, and in it, we get the canvas element. All the chart components are registered in themountedlifecycle method, and a newChartobject is initialized. TheChartobject takes in two parameters; the canvas element we want to render the chart on and a configurations object, which in this case is barChartData.Vuecalls themountedhook when our component is added to theDOM.
See the completed BarChart.vue component code below:
<template>
    <div>
        <canvas id="bar-chart"></canvas>
    </div>
</template>

<script>
import { Chart, registerables } from 'chart.js';
import barChartData from "../data/chart-data";

export default {
    name: "BarChart",
    data() {
        return {
            barChartData
        }
    },
    mounted() {
        const ctx = document.getElementById("bar-chart");
        Chart.register(...registerables);
        new Chart(ctx, this.barChartData);
    }
};
</script>
Next, in the index.vue file, we will replace the boilerplate code with the code below:
<template>
  <BarChart />
</template>

<script>
import BarChart from '../components/BarChart.vue';

export default {
  name: "IndexPage",
  components: { BarChart }
}
</script>
We import the BarChart component and set it in between the template element. We then export our component name and the components object, which lists all the components we use in the index.vue file.
After successfully following the steps above, we run the command below in our terminal:
$ npm run dev
The above command will spin up a development server on http://localhost:3000, which we can use to view the application. Check the image below to see the outcome:

We can hover over each bar to get more information about that section.
This article showed how to create bar charts in Nuxt.js applications using chart.js.
You may find these resources helpful:
