
One of the best things about working for Cloudinary is the amazing brands that trust us to manage tens of billions of images and videos. These companies span many industries, including retail, eCommerce, media, entertainment, travel and more. These brands understand that first impressions matter and that strong visual experiences engage users, create loyalty and drive revenue. So what can we learn from these brands and their loyal users?
With privacy top of mind, we wondered what we might learn from analyzing the large volume of data. What user behaviors would we discover, what regional differences might exist? What insights or early hints from different industries could we extrapolate? These questions guided us as we analyzed millions of anonymous end-user experiences and asset interactions across our platform.
From the results of our analysis from the last quarter in 2018, we are so pleased to deliver our first State of Visual Media Report. Our goal is to help you gain business and technical insights on the power of visual storytelling. You can read the full interactive report here.
This is just the beginning of what we hope will help us all tell better visual stories. From this report, here are 3 of my favorite insights:
-
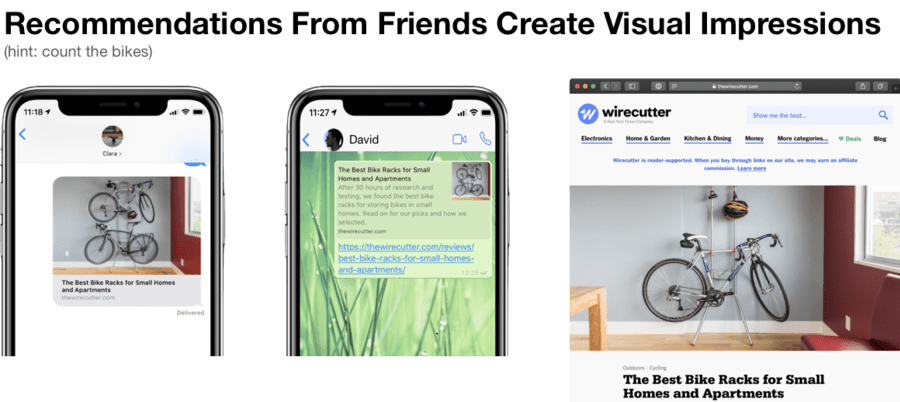
Group-chat apps like Slack, WeChat and WhatsApp behave just like traditional browsers when friends share recommendations. Morning and night, we click and share links with our friends and co-workers:
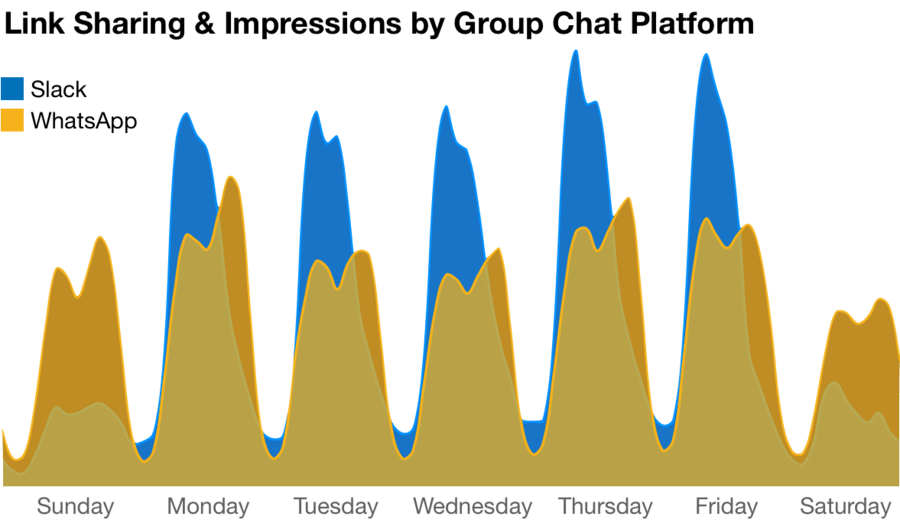
These word of mouth referrals require attentive care for the visual hook and are potentially more valuable than traditional platforms like Instagram and Twitter.
-
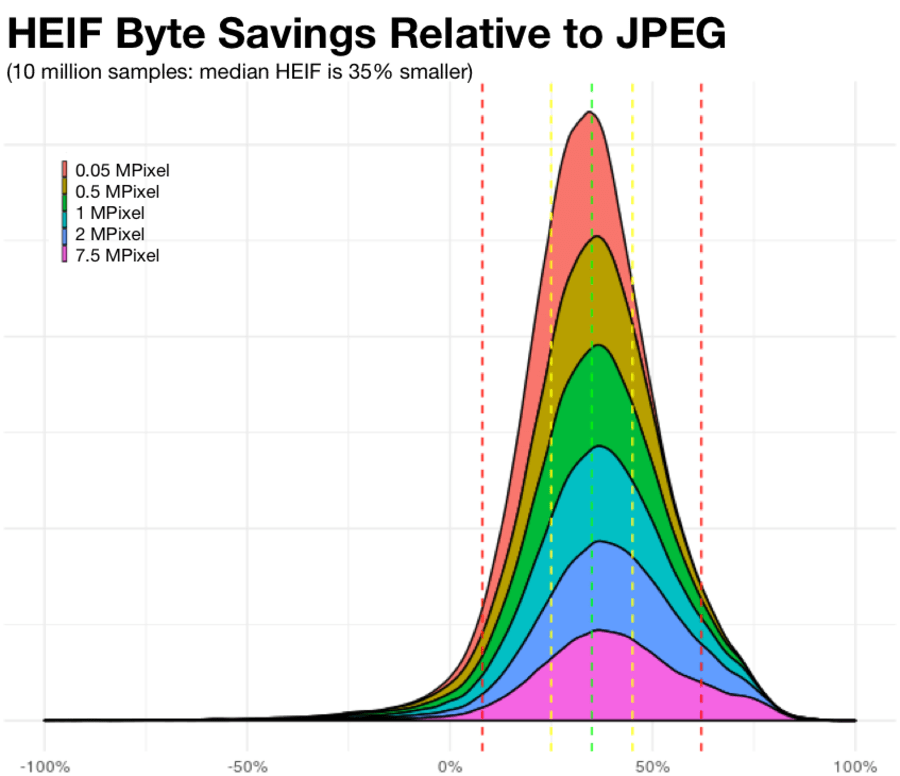
Your loyal users will download your native Android or iOS application. You can reward these loyal users with superior visual experiences. New file formats like HEIF can be deployed in apps today, but they enable wide-gamut colors imagery and HDR experiences. In addition, HEIF is 30-40% smaller than traditional JPEGs!
-
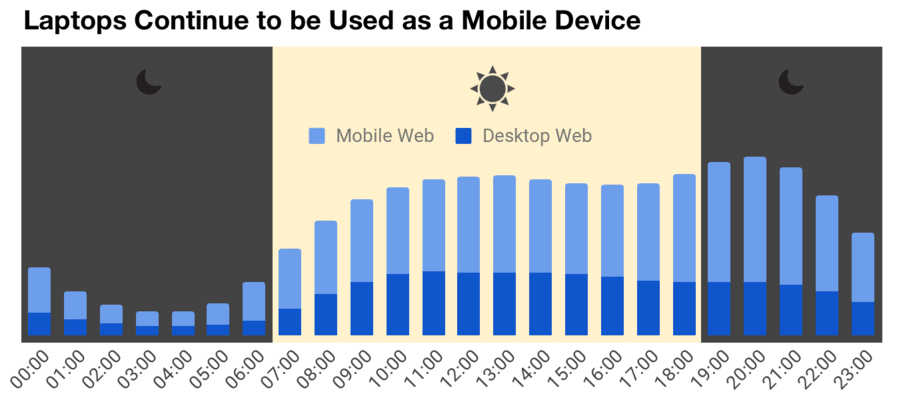
We all understand the importance of “mobile” web experiences. Yet, “desktop” web usage remains steady at 35% of global traffic. This is because laptops are increasingly used like mobile devices – in Starbucks, tethered while in an Uber, or while sitting on the couch, watching Netflix. Now, more than ever, Responsive-Web-Design requires your brand to be mobile-first and desktop-friendly.
In upcoming posts we will explore these insights and others in more detail.
We hope the report and its insights help guide your visual content creation and delivery. Do let us know what you think in the Comments section below. This report is just the beginning, and we’re looking forward to the next edition!