
- Cloudinary is committed to openness and transparency
- Server-Timing is now available on-demand with the request header
Pragma: server-timing - We plan to make this “always-on” in the near future
- We want to hear your feedback
This week at the #PerfMatters Conference, we learned about the importance of performance measurement and new standards like Server-Timing that is available in Chrome 65, Opera and soon Firefox.
At Cloudinary we are committed to transparency and accountability. That’s why I’m really excited to announce that we now support Server-Timing for all our customers! Today, Server-Timing is available on-demand, but in the near future we will enable this broadly – enabling greater insights with your RUM solutions.
Server-Timing is now enabled on-demand for all customers. It can be enabled on the client side by adding the header Pragma: server-timing
In curl, you can add it with -H "Pragma: server-timing":
curl http://res.cloudinary.com/colinbendell/sample.jpg -H "Pragma: server-timing" -D - -I
(-D - sends headers to the console, -I is for a head request so you don’t see the bytes)
In return, you will see:
Date: Wed, 28 Mar 2018 15:22:05 GMT
Content-Type: image/jpg
Server-Timing: cloudinary;dur=105;start=1522250525.545;total=105
Server-Timing: akam;dur=18;start=1522250525.454;total=233;desc="~(cache~'miss~rtt~6~id~'42c1b76~pconn~1~f_pconn~1)"
Or in your browser, you can add it with a Chrome Extension:
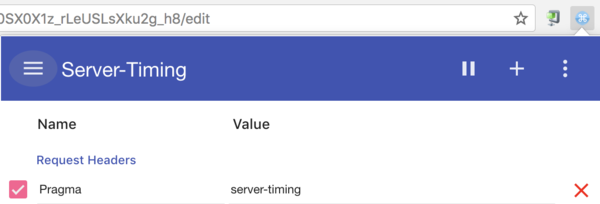
Now you can see it your devtools:
And you can query it via javascript:
window.performance.getEntries()
Code language: CSS (css)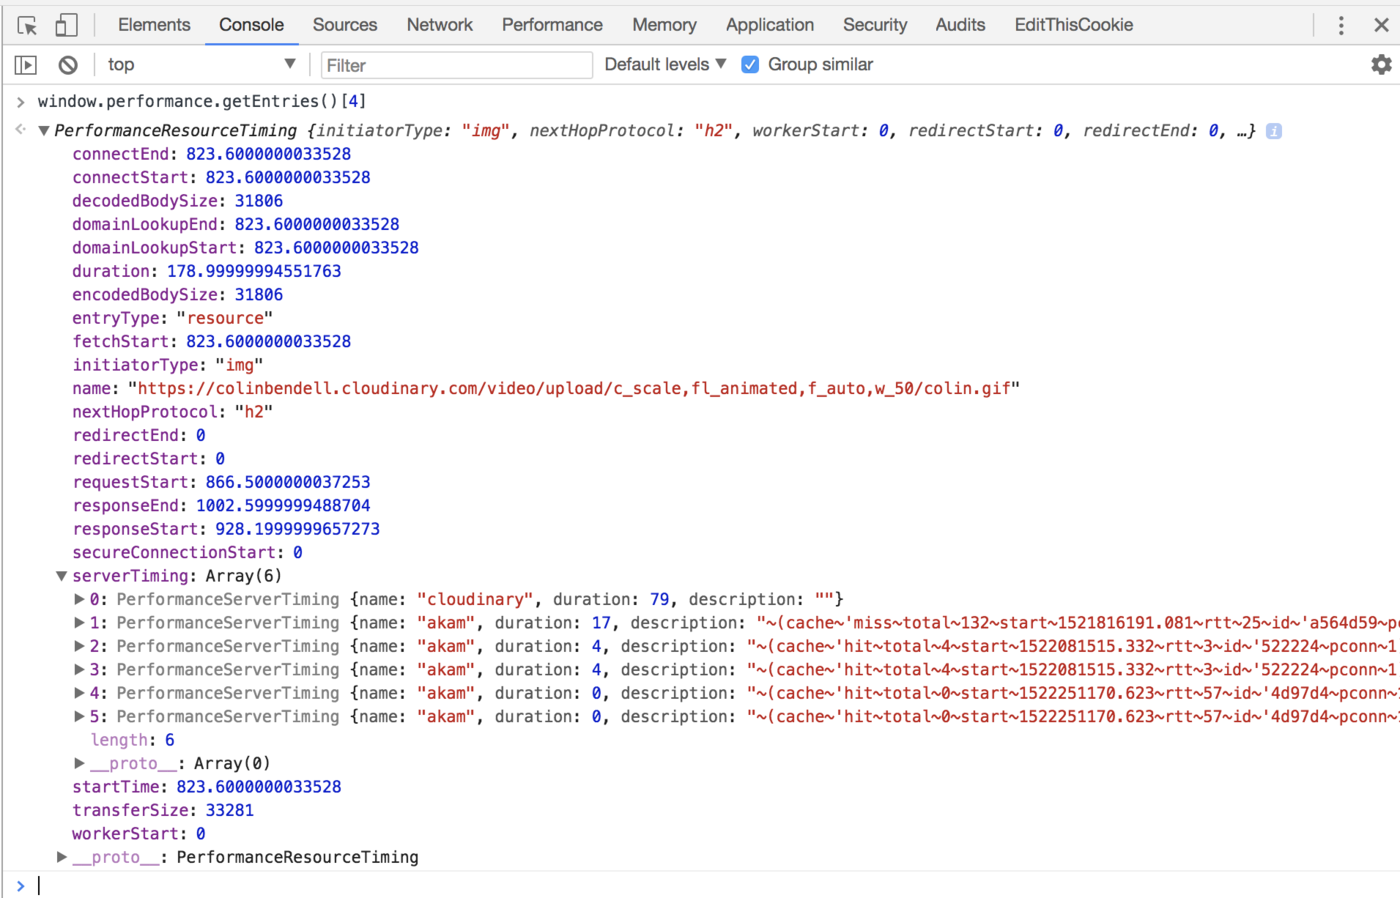
In our first iteration, we are sharing a number of operational details. In the desc field you will notice a jsurl encoded payload.
This iteration exposes a few interesting details:
-
start(epoch.ms) – the start time – from the server’s perspective -
total(ms) – the total ‘clock-time’ to turn the response around. This is important if there were dependencies. -
dur(ms) – the duration or ‘effort-time’ to satisfy the request. This would be the cpu, io, etc from the time the request started totalled until the bytes were flushed to the network as a response. -
rtt(ms) – the TCP round-trip-time from the last packet from the server’s perspective. -
cache– hit or miss -
pconn– the request count on the TCP socket -
fpconn– the request count on the outgoing TCP socket
Yes, it isn’t human readable, but this is the only mechanism that allows Javascript to programmatically access these extra fields.
A few important notes:
- There are three different names exposed:
cloudinary,akamaiandfastly. This relates to the different service providers. The first is the entry from our servers, the last two are from the CDNs we use - Multiple
Server-Timingentries – one for each ‘hop’ along the journey - Check the
starttime! HistoricalServer-Timingentries are also preserved. It might be a cache-hit on our CDN, but you will still see where this entry came from, when it was added to the cache, etc.
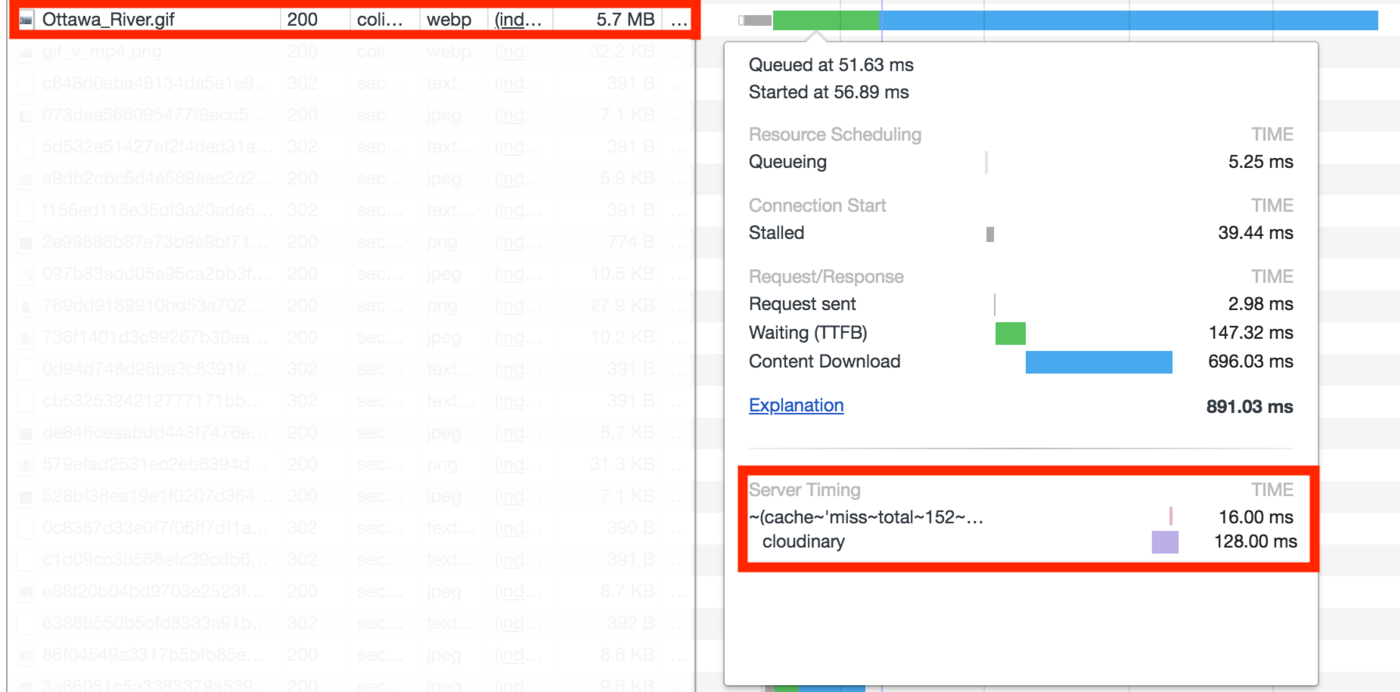
Here are some of the interesting observations we have found already with this additional insight:
Consider the following responses:
server-timing: cloudinary;dur=94;start=1516653847.986;total=94
server-timing: akam;dur=16;start=1516653847.922;total=207;desc="~(cache~'miss~rtt~57~id~'1ca34068~pconn~7~f_pconn~1)"
server-timing: akam;dur=16;start=1516653847.879;total=278;desc="~(cache~'miss~rtt~26~id~'9ca8e39~pconn~1~f_pconn~1)"
Here is the break down of the above (reading from bottom up, since the headers were added cumulatively):
- from the Browser’s perspective, this resource took ~400ms:
let resTiming = window.performance.getEntries()[4];
resTiming.responseStart - resTiming.requestEnd;

398
- the CDN edge node took 278 ms to complete this request (total=278)
- it was a cache-miss
- in turn, the CDN used a parent node which took 207ms from its perspective (total=207)
- it too was a cache-miss and required to go to origin
- finally, this turned around and made a request to our servers which took 94ms.
Where did the time go?
- first the browser to the CDN needed a TCP connection. The RTT is 26ms, so ~100ms is used connecting TCP.
- the layers of the CDN needed to connect and so on to the origin
- the actual think-time is 94ms
- the extra time is in the TCP overhead, not on server think time.
- if we had a cache-hit none of this extra tax would be applied
Our lesson learned: Once again, caching is important – see #2 in Souder’s web performance rules. A cache miss can cause the user to wait because of the TCP handshakes over the wire. All the more reason we need to maximize our use of CDNs.
There are many interesting experiments that we hope this data could help illuminate. For example, is your personalized-hero image slow to load because it isn’t being cached and is being generated on demand? What is the conversion rate for cache-hits? These are interesting hypotheses which are now easily observed. With RUM tools like Lux, you can add a little bit of Javascript to add to your performance dashboard:
let LUX = window.LUX;

//find the hero image in the browser’s server timing
let heroImg = window.performance.getEntriesByName(‘personalized-hero’).serverTiming;

// test for the cache hit
let cacheHit = /cache~’hit/.test(heroImg[heroImg.length - 1].description);

// add the value to the lux data
LUX.addData('personalized-hero', cacheHit ? 1 : 0);
From there, you can easily graph the results from real-world impact for your users. Exciting!
As with anything “new” there are many reasons why not to adopt or support it. Below is a list of the objections we’ve quickly contemplated along with our current perspective:
-
Our dev team – We will expose our technical debt and we don’t know what skeletons might be in the closet!
Yup. We expect a few embarrassments. No company is perfect, and no technology is without technical debt. Yet, this will help us focus on what is important to our customers and help raise the bar in the quality of service we deliver.
-
Our product team – Won’t this put us out of business? Won’t we reveal too much and customers will build it themselves?
Maybe. But unlikely. Ideas are free and abundant. If the service we provide can be put out of business by being transparent with our performance, then we are not delivering enough value to our customers.
-
As a customer, won’t this slow down the download for my users with these extra headers?
This is a concern that we share and why we want to act prudently. In reality, the extra
Server-Timingheaders will amount to ~100 Bytes. On a typical image that is 24KiB, this is a 0.4% increase. This will not increase the number of packets sent to the user since many packets are ‘half-empty’ anyway. This is something we will be observing and will report back in the near future before we turn this on by default.
We have many things planned. We want to expose more details, make this more relevant for you, and help drive insight to your business.
First we need to find the balance between what is germane and actionable, in contrast to what is simply ‘interesting’. We will make more announcements of the details we are sharing in the near future. If you have opinions and thoughts, we’d love to hear them.
More importantly, we have some great ideas about how to use Server-Timing to improve your business. Really exciting ideas in fact. Stay tuned!
The spec is still evolving. You’ll notice that we are using a few non-standard fields like total and start. As well we are “using” the desc field to provide custom details. We will make changes as the spec evolves.
As mentioned previously, this is the beginning. We are committed to providing you more transparency and insight to our services. If you have opinions, ideas, or concerns we would love to hear them. How can we provide you more details to help your business? To help your operations teams? To help your marketing teams? We want to hear from you! Please leave your thoughts in the comment section below.
In the next instalment we will explore Server-Timing in more detail and some of the exciting use cases we are pursuing.