
Adding video engagement metrics to your video dashboard provides valuable insights into the success of your video content. This tutorial will guide you through adding engagement metrics to your video dashboard using the Cloudinary video analytics library in a Next.js application.
You’ll add the following engagement metrics:
- Total views.
- Engagement rate.
- Average watch time in seconds.
- Countries.
- Applications, e.g., browser.
- Operating systems.
Cloudinary provides a comprehensive and secure API for tracking video analytics and quickly uploading media files from a server, browser, or mobile application.
Here’s the GitHub repository.
You should have:
- Node.js installed on your computer.
- Knowledge of Next.js.
- Understanding of JavaScript.
- A free Cloudinary account.
We’ll provide a starter project to help you speed through to the analytics implementation. The project includes a video hosted by Cloudinary, to which you’ll add engagement metrics. Additionally, the project utilizes chart.js, a charting library that enables you to create simple and interactive charts using the HTML5 <canvas> element.
Clone the starter project into your preferred folder and check out to the starter branch using the following git command.
git clone https://github.com/Olanetsoft/cloudinary-video-metrics-nextjs.git
cd cloudinary-video-metrics-nextjs
git checkout starterCode language: PHP (php)
Run the following command to install all dependencies using the npm package manager, and start the project on http://localhost:3000.
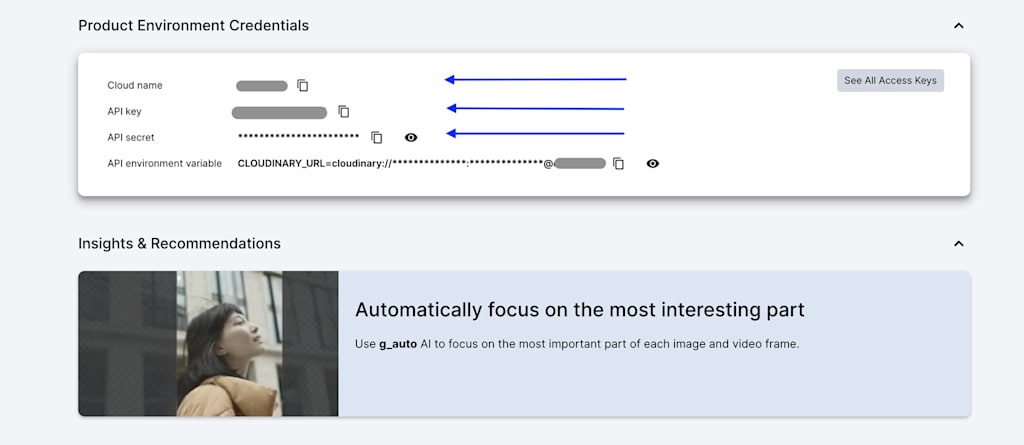
npm install && npm run devLog in to your Cloudinary dashboard to retrieve product environment credentials such as the Cloud name, API key, and API secret.
Then, create a .env.local file in the root folder of the project using the following command:
For macOS and Linux:
touch .env.localCode language: CSS (css)For Windows(Command Prompt):
type NUL > .env.localCode language: CSS (css)For Windows(PowerShell):
New-Item -Path .env.local -ItemType FileCode language: CSS (css)Add your product credentials to the environment file:
NEXT_PUBLIC_CLOUDINARY_CLOUD_NAME="*********************"
NEXT_PUBLIC_CLOUDINARY_API_KEY="*********************"
NEXT_PUBLIC_CLOUDINARY_API_SECRET="*********************"Code language: JavaScript (javascript)
Replace ********************* with your credentials.
We’ll use a video already on Cloudinary for this demo. In your implementation, you should have handled the video upload to Cloudinary and retrieved the video’s public ID on the frontend.
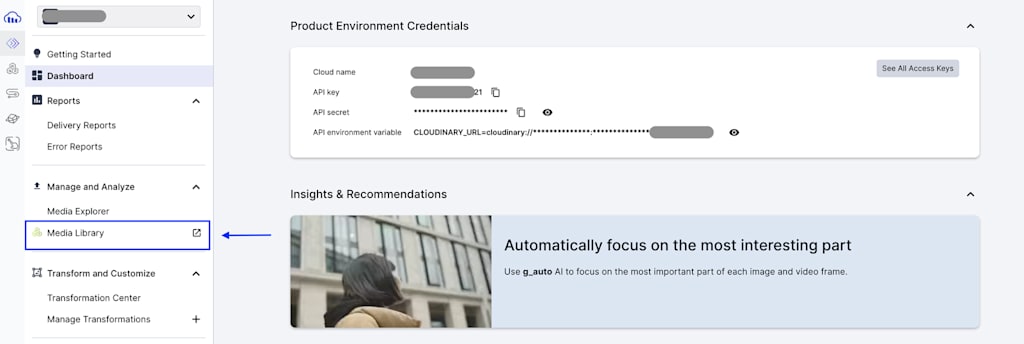
You can obtain a public ID for your video by accessing your media library on Cloudinary. To do this, go to the Media Library on your dashboard.
Next, copy the link.
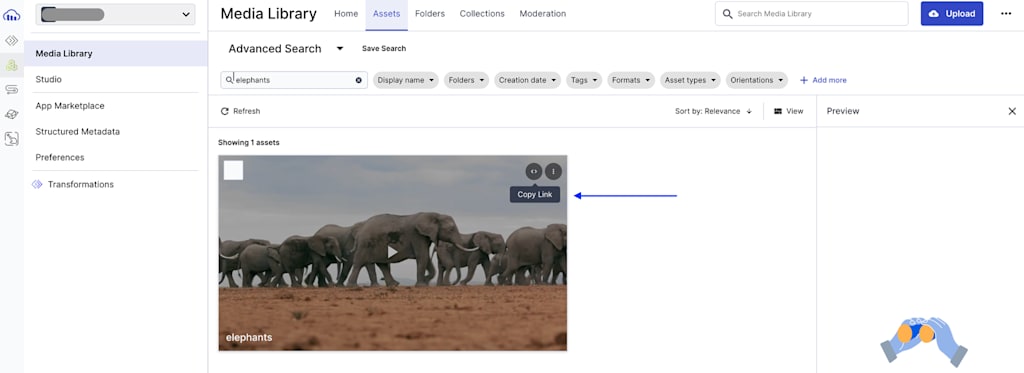
The link you copied should look like this: https://res.cloudinary.com/<your-cloud-name>/video/upload/v1554336425/<public_id>.mp4. Add the public_id value to your .env.local.
If you don’t have any videos in your media library yet, you can upload one and follow the same step above to copy the video’s public ID. Learn about how to upload videos on Cloudinary.
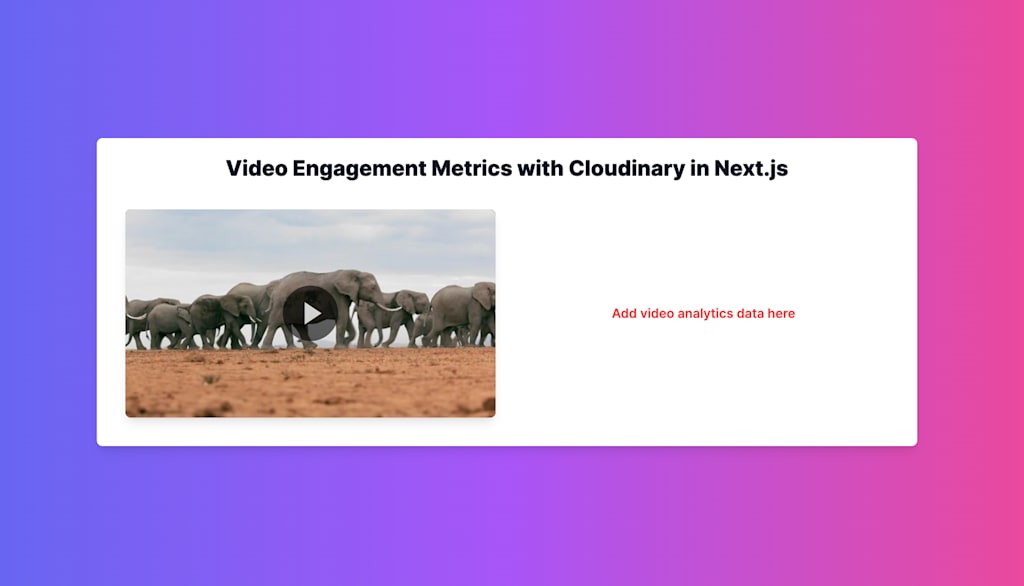
NEXT_PUBLIC_CLOUDINARY_PUBLIC_ID="*********************"Code language: JavaScript (javascript)Navigate to your browser and access http://localhost:3000, where the project is running. You should see something similar to what is shown below displaying your video.
Cloudinary offers a video analytics engagement feature that can be accessed directly on your Cloudinary Console by selecting Analytics. Here, you’ll find a set of metrics and graphs that display how your video content has been delivered. For this tutorial, you’ll go beyond the Cloudinary dashboard metrics to implement the same metrics on your app dashboard.
The Cloudinary Video Player automatically collects metrics for all videos delivered through it. To collect analytics for videos not delivered through the Cloudinary Video Player, you can install the JavaScript library and configure it on any page with a video player or by accessing video view data programmatically. In this step, you’ll learn how to access video data programmatically within your Next.js application.
To fetch the analytics data, create a folder in the root directory called utils and add a file fetchAnalyticsData.js. In this file, you’ll make API requests to https://api.cloudinary.com/v1_1/<cloud name>/video/analytics/views?expression=video_public_id=<public id> with your cloud name, video public ID, API key, and API secret to retrieve the analytics data. Learn more about the parameters.
In this example, you must add max_results=500 to the API request to increase the limit of the data returned from the API. The default limit is five, as stated in the documentation.
The query would be: https://api.cloudinary.com/v1_1/${process.env.NEXT_PUBLIC_CLOUDINARY_CLOUD_NAME}/video/analytics/views?expression=video_public_id=${process.env.NEXT_PUBLIC_CLOUDINARY_PUBLIC_ID}&max_results=500.
Update the fetchAnalyticsData.js file with the following content:
// utils/fetchAnalyticsData.js
"use server";

const fetchAnalyticsData = async () => {
  const response = await fetch(
    `https://api.cloudinary.com/v1_1/${process.env.NEXT_PUBLIC_CLOUDINARY_CLOUD_NAME}/video/analytics/views?expression=video_public_id=${process.env.NEXT_PUBLIC_CLOUDINARY_PUBLIC_ID}`,
    {
      headers: {
        Authorization: `Basic ${btoa(
          `${process.env.NEXT_PUBLIC_CLOUDINARY_API_KEY}:${process.env.NEXT_PUBLIC_CLOUDINARY_API_SECRET}`
        )}`,
      },
    }
  );

  if (!response.ok) {
    throw new Error("Failed to fetch analytics data");
  }

  const data = await response.json();

  console.log(data) // Log the data
  return data;
};

export default fetchAnalyticsData;Code language: JavaScript (javascript)
To test and verify that the fetchAnalyticsData.js script is correctly fetching the video analytics data from Cloudinary, you’ll need to run a simple test that outputs the results to your web browser’s console. To do that, navigate to page.js inside the app folder and import it as shown below.
// app/page.js

//...
import fetchAnalyticsData from "../utils/fetchAnalyticsData";

export default function Home() {
  return (
    <main className="flex min-h-screen flex-col items-center justify-center p-6 bg-gradient-to-r from-indigo-500 via-purple-500 to-pink-500">

         <FetchAnalyticsData /> // Add it here

    </main>
  );
}Code language: JavaScript (javascript)
Check your console; similar data is logged below.
{
  request_id: 'e57c6631699ffd338a23958a30a05777',
  next_cursor: '2a54714067686dc630b44e3b863163dc',
  data: [
    {
      video_public_id: '<your_public_id>',
      video_duration: 48,
      video_transformation: 'f_auto:video',
      video_extension: '',
      viewer_application_name: 'Chrome',
      viewer_location_country_code: 'NG',
      viewer_os_identifier: 'Mac OS X 10.15.7',
      view_watch_time: 0,
      view_ended_at: '2024-05-19T10:32:27.000Z'
    },
    {
      video_public_id: '<your_public_id>',
      video_duration: 48,
      video_transformation: 'f_auto:video',
      video_extension: '',
      viewer_application_name: 'Chrome',
      viewer_location_country_code: 'NG',
      viewer_os_identifier: 'Mac OS X 10.15.7',
      view_watch_time: 41,
      view_ended_at: '2024-05-19T10:32:26.000Z'
    },
....Code language: CSS (css)In the previous section, you created a function to fetch the video engagement data. Next, you’ll implement the video analytics data page to preview the info on your application. Create a folder called components and add a file called VideoAnalyticsData.js.
Import the required dependencies and the script you wrote earlier to fetch video analytics data.
// components/VideoAnalyticsData.js

import { useEffect, useState } from "react";
import { Bar } from "react-chartjs-2";
import {
  Chart as ChartJS,
  CategoryScale,
  LinearScale,
  BarElement,
  Title,
  Tooltip,
  Legend,
} from "chart.js";
import fetchAnalyticsData from "../utils/fetchAnalyticsData";

ChartJS.register(
  CategoryScale,
  LinearScale,
  BarElement,
  Title,
  Tooltip,
  Legend
);

const VideoAnalyticsData = () => {
  //...
}
export default VideoAnalyticsData;Code language: JavaScript (javascript)Create the state variable called analyticsData and implement useEffect to save the data retrieved into the variable once the component mounts.
// components/VideoAnalyticsData.js

//...
const VideoAnalyticsData = () => {
  const [analyticsData, setAnalyticsData] = useState(null);

  useEffect(() => {
    const fetchData = async () => {
      try {
        const data = await fetchAnalyticsData();
        setAnalyticsData(data);
      } catch (error) {
        console.error("Error fetching analytics data:", error);
      }
    };

    fetchData();
  }, []);
}Code language: JavaScript (javascript)
Validate if the data is ready. If not, display a spinner on the UI.
// components/VideoAnalyticsData.js

const VideoAnalyticsData = () => {

  //...
  if (!analyticsData) {
    return (
      <div className="flex items-center justify-center w-full mt-8">
        <div className="w-16 h-16 border-4 border-dashed rounded-full animate-spin border-gray-500"></div>
      </div>
    );
  }
}

//...
}Code language: JavaScript (javascript)Now that you have all the necessary data, you can display the data on the UI using Chart.js with the following code snippet:
// components/VideoAnalyticsData.js
//...

const VideoAnalyticsData = () => {
  //...

  // Get total views
  const totalViews = analyticsData.data.length;
  const totalVideoDuration = analyticsData.data[0]?.video_duration || 0;
  const countries = analyticsData.data.map(
    (item) => item.viewer_location_country_code
  );
  const os = analyticsData.data.map((item) => item.viewer_os_identifier);
  const applications = analyticsData.data.map(
    (item) => item.viewer_application_name
  );
  const watchTimes = analyticsData.data.map((item) => item.view_watch_time);

  const countryCounts = countries.reduce((acc, country) => {
    acc[country] = (acc[country] || 0) + 1;
    return acc;
  }, {}); // Get Country

  const osCounts = os.reduce((acc, system) => {
    acc[system] = (acc[system] || 0) + 1;
    return acc;
  }, {}); // Get OS

  const appCounts = applications.reduce((acc, app) => {
    acc[app] = (acc[app] || 0) + 1;
    return acc;
  }, {}); // Get Application

  const totalWatchTime = watchTimes.reduce((acc, time) => acc + time, 0);
  const averageWatchTime = (totalWatchTime / totalViews).toFixed(2);
  const engagementRate =
    totalVideoDuration > 0
      ? ((averageWatchTime / totalVideoDuration) * 100).toFixed(2)
      : 0; // Total watch time, average watch time and engagemenr rate.
}Code language: JavaScript (javascript)
In the snippet above, we retrieved the individual data points from the dataset returned. The data points for engagementRate and averageWatchTime are also computed.
Next, create a dataset for the chart to display the country, operating system, and application information.
// components/VideoAnalyticsData.js
//...

const VideoAnalyticsData = () => {
  //...
  const countryChartData = {
    labels: Object.keys(countryCounts),
    datasets: [
      {
        label: "Views by Country",
        data: Object.values(countryCounts),
        backgroundColor: "rgba(75, 192, 192, 0.6)",
        borderColor: "rgba(75, 192, 192, 1)",
        borderWidth: 1,
      },
    ],
  };

  const osChartData = {
    labels: Object.keys(osCounts),
    datasets: [
      {
        label: "Views by OS",
        data: Object.values(osCounts),
        backgroundColor: "rgba(153, 102, 255, 0.6)",
        borderColor: "rgba(153, 102, 255, 1)",
        borderWidth: 1,
      },
    ],
  };

  const appChartData = {
    labels: Object.keys(appCounts),
    datasets: [
      {
        label: "Views by Application",
        data: Object.values(appCounts),
        backgroundColor: "rgba(255, 159, 64, 0.6)",
        borderColor: "rgba(255, 159, 64, 1)",
        borderWidth: 1,
      },
    ],
  };
  //...
}Code language: JavaScript (javascript)
Next, update the UI.
//...

const VideoAnalyticsData = () => {

  //...

  return (
    <div className="flex flex-col items-center w-full bg-white rounded-lg shadow-lg p-6">
      <h2 className="text-2xl font-bold mb-4 text-gray-900">
        Video Analytics Summary
      </h2>
      <div className="grid grid-cols-1 md:grid-cols-2 gap-4 w-full">
        <div className="bg-gray-100 rounded-lg p-4 shadow">
          <h3 className="text-lg font-semibold text-gray-700 text-center mb-4">
            Total Views
          </h3>
          <p className="text-2xl font-bold text-gray-900 text-center">
            {totalViews}
          </p>
        </div>
        <div className="bg-gray-100 rounded-lg p-4 shadow">
          <h3 className="text-lg font-semibold text-gray-700 text-center mb-4">
            Avg Watch Time (seconds)
          </h3>
          <p className="text-2xl font-bold text-gray-900 text-center">
            {averageWatchTime}
          </p>
        </div>
        <div className="bg-gray-100 rounded-lg p-4 shadow">
          <h3 className="text-lg font-semibold text-gray-700 text-center mb-4">
            Engagement Rate (%)
          </h3>
          <p className="text-2xl font-bold text-gray-900 text-center">
            {engagementRate}
          </p>
        </div>
        <div className="bg-gray-100 rounded-lg p-4 shadow">
          <h3 className="text-lg font-semibold text-gray-700 text-center">
            Countries
          </h3>
          <Bar data={countryChartData} />
        </div>
        <div className="bg-gray-100 rounded-lg p-4 shadow">
          <h3 className="text-lg font-semibold text-gray-700 text-center">
            Operating Systems
          </h3>
          <Bar data={osChartData} />
        </div>
        <div className="bg-gray-100 rounded-lg p-4 shadow">
          <h3 className="text-lg font-semibold text-gray-700 text-center">
            Applications
          </h3>
          <Bar data={appChartData} />
        </div>
      </div>
    </div>
  );
};

export default VideoAnalyticsData;Code language: JavaScript (javascript)You’re all set! Import the VideoAnalytics.js component, delete the “Add video analytics data here” placeholder, and delete the fetchDataAnalytics imported earlier with the following code snippet:
// app/page.js

//..
import VideoAnalyticsData from "../components/VideoAnalyticsData";

export default function Home() {
  return (
    <main className="flex min-h-screen flex-col items-center justify-center p-6 bg-gradient-to-r from-indigo-500 via-purple-500 to-pink-500">
      <section className="flex flex-col items-center w-full max-w-6xl mt-8 bg-white rounded-lg shadow-lg p-6">
           {/* ... */}
          <div className="w-full md:w-1/2 p-4">
            <VideoAnalyticsData /> // Add it here
          </div>
        </div>
      </section>
    </main>
  );
}Code language: PHP (php)If you’ve made it this far, congratulations! It’s time to test the application and see all the video engagement data and analytics. You should have something similar to what is shown below:
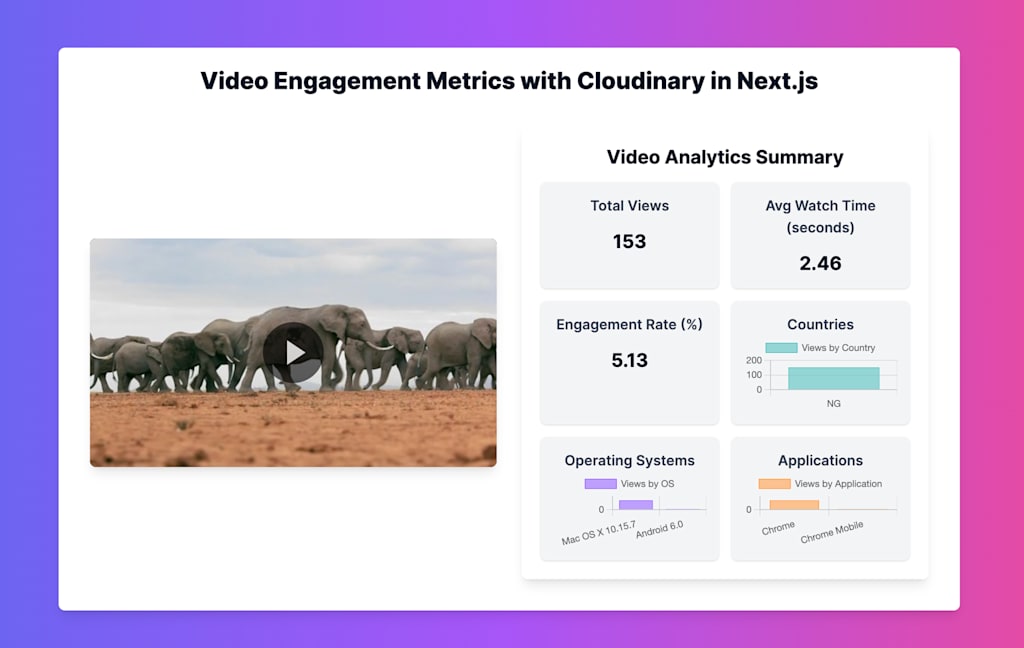
This blog post shows you how to add engagement metrics to your video dashboard using the Cloudinary video analytics library in your Next.js application. You can try to compute and render other metrics from the provided data.
If you found this blog post helpful and want to discuss it in more detail, head over to the Cloudinary Community forum and its associated Discord.