Bar charts are one of the most effective ways to display and represent data. They are commonly used to highlight comparisons between categories of data.
Having a bar chart in our web application helps convey relational information quickly. This article will demonstrate creating a bar chart in a Next.js application.
In the realm of web charts, Chart.js is a prominent JavaScript library that simplifies the process of crafting interactive charts. While Chart.js can be used directly in a variety of JavaScript environments, our approach here employs a React-focused wrapper around it. This ensures a seamless integration with Next.js, a React framework. But before diving in, it’s noteworthy that Chart.js is versatile enough to support different types of charts like line charts, pie charts, and radar charts.
We completed this project in Codesandbox. Fork and run it to quickly get started.
Check out the complete source code here:
https://github.com/shosenwales/Next-Chart
To follow this tutorial, we’ll need a basic understanding of JavaScript and Next.js.
We’ll start by creating a new Next.js project by running the following command:
 npx create-next-app <project-name>
Code language: HTML, XML (xml)
After successfully creating a project, we need to navigate into the project directory and start our development server by running the following commands:
cd <project-name>  #changing directory
npm run dev        #starting development server
Code language: CSS (css)
Next.js will start a development environment, which can be accessed at http:localhost:3000.
To create our chart, we’ll be using a package called react-chartjs-2. This package serves as a bridge between the Chart.js library and React, letting us utilize Chart.js features in a React-friendly manner. If you’re familiar with Chart.js, you’ll recognize some similarities in configuration and setup, but with the added benefit of integrating it seamlessly with Next.js. It is a wrapper for chart.js that allows us to use charts.js elements as react components, making it easier to implement charts.
We can install it by running the following command:
 npm i react-chartjs-2 chart.js
Code language: CSS (css)
Next, let’s edit our index.js by replacing it with the following code snippet:
import { Bar } from "react-chartjs-2";
    import Chart from "chart.js/auto";
    const VulnChart = () => {
      return (
        <div>
          <Bar
            data={{
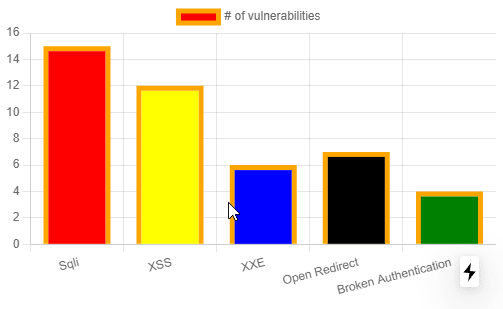
              labels: ["Sqli", "XSS", "XXE", "Open Redirect", "Broken Authentication"],
              datasets: [
                {
                  label: "# of vulnerabilities",
                  data: [15, 12, 6, 7, 4],
                  backgroundColor: ["red", "yellow", "blue", "black", "green"],
                  borderColor: "orange",
                  borderWidth: 5
                },
              ]
            }}
            height={300}
            width={500}
            options={{
              maintainAspectRatio: false
            }}
          />
        </div>
      );
    };
    export default VulnChart;
Code language: JavaScript (javascript)
Let’s take a closer look at the code snippet above:
First, we imported the Bar component from react-chartjs-2. Next, we used the Bar component, which takes in the data object, width, and height. The data object contains labels and datasets.
labels which is an array of data displayed on the x-axis(bottom) of the chart, representing each column. datasets is a collection of objects that represents specific data value and contains different properties such as:
-
label: Usually displayed on top of the chart and toggles on and off the chart when clicked -
data: Data values -
backgroundColor: Specifies the color for our data values, a single color or multiple colors can be specified, used standard colors or rgba -
borderColor: sets the border color for our data values single color or multiple colors can be specified, uses standard colors or rgba -
borderWidth: Specifies amount of border width
Now we should have the result below in our browser:

We can also create multiple datasets and toggle between them. We can do that by adding another object to our datasets. At this stage, our index.js should be similar to this:
import { Bar } from "react-chartjs-2";
    import Chart from "chart.js/auto";
    const VulnChart = () => {
      return (
        <div>
          <Bar
            data={{
              labels: [
                "Sqli",
                "XSS",
                "XXE",
                "Open Redirect",
                "Broken Authentication"
              ],
              datasets: [
                {
                  label: "# of vulnerabilities",
                  data: [15, 12, 6, 7, 4],
                  backgroundColor: ["red", "yellow", "blue", "black", "green"],
                  borderColor: "orange",
                  borderWidth: 5
                },
                {
                  label: "Web Apps",
                  data: [20, 13, 6, 8, 9],
                  backgroundColor: "purple",
                  borderColor: "red",
                  borderWidth: 5
                }
              ]
            }}
            height={300}
            width={500}
            options={{
              maintainAspectRatio: false
            }}
          />
        </div>
      );
    };
    export default VulnChart;
Code language: PHP (php)
https://www.dropbox.com/s/rmv9tsjy1ox095x/giphy%281%29.mp4?dl=0
Should you decide to go beyond bar charts, remember that Chart.js provides a plethora of chart types to visualize your data. And while we’ve shown you a bar chart example, creating a line chart or pie chart follows a similar structure but with some modifications in the type and data configuration.
This post discussed how to create a bar chart in Next.js applications. Always use code with caution and ensure you familiarize yourself with the official documentation of any libraries or frameworks you integrate into your projects for a comprehensive understanding and best practices.
