Growing a following without understanding viewer behavior is expensive. You publish more videos and promote, but results stay flat.
Views lie. They tell you someone clicked, not why they stayed or why they left. Most creators never see the moment interest drops. Was it the intro? The pacing? Maybe the hook? Without that data, every video is a gamble.
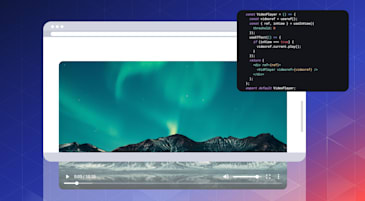
Video analytics removes the guesswork by showing exactly how real viewers interact with your content. In this project, we built a lightweight video analytics dashboard using Next.js, vanilla JavaScript, and Cloudinary Video Analytics.
Let’s build a small, focused system that shows where viewers drop off:
- A simple video player. This uses Cloudinary to deliver the video and capture engagement events.
-
A tracking layer. A lightweight JavaScript library (
cloudinary-video-analytics) listens to play, pause, and watch time events and sends them to Cloudinary Video Analytics. - A creator dashboard. This pulls raw analytics data programmatically from Cloudinary’s API and turns it into readable insights.
By utilizing the Cloudinary Video Analytics API and JS library, you can identify plays, watch time/rate, unique viewers, and where they drop off in the video.
Every chart answers a practical question a creator asks before publishing the next video. The system runs on Next.js with a clean UI built using shadcn/ui. Analytics requests stay server-side using basic authentication to keep your API key and secret safe.
These insights change how you plan content, turning random growth into intentional growth.
- Live demo: https://video-insights-demo.vercel.app/
- Source code: https://github.com/musebe/video-insights-demo
The project uses Next.js with the App Router, providing server routes, client components, and fast iteration capabilities.
The initial setup is simple and focused:
npx create-next-app@latest video-insights-demo
Code language: CSS (css)
We’ll choose TypeScript, the App Router, and Tailwind CSS to keep the foundation lightweight and strictly typed.
Next, we’ll add shadcn/ui for the interface:
npx shadcn@latest init
Code language: CSS (css)
This provides clean, accessible UI components without locking us into a heavy design system. Cards, buttons, badges, and layout pieces are added only when needed.
The folder structure remains organized and purposeful:
-
app/for routes and pages. -
app/api/** for server-only analytics endpoints to keep credentials secure. -
components/for reusable UI and video tracking logic. -
lib/for Cloudinary helpers and authentication utilities.
Environment variables handle all secrets, ensuring nothing sensitive touches the client-side code.
At this point, we have a fast, modern Next.js app; a clean UI foundation, and a secure architecture to safely interact with Cloudinary’s APIs.
This is where the guessing stops. Cloudinary Video Analytics works with more than just the default Cloudinary player; it can track engagement on any HTML5 video element. This flexibility is crucial because it allows you to maintain full control over your UI while leveraging powerful backend analytics.
We’ll use the Cloudinary Video Analytics JavaScript library with manual tracking. Manual tracking is chosen for its precision, as it avoids “hidden magic” and is ideal for dynamic elements or custom domains where you need to explicitly provide a cloud name and public ID.
The implementation follows a simple, three-step process:
- The video loads from Cloudinary using a standard
<video>tag. - We’ll connect the analytics tracker to the element on the client side after the video mounts using
connectCloudinaryAnalytics(videoElement). - We’ll start a tracking session by calling
startManualTrackingwith your Cloudinary credentials.
This single call instructs Cloudinary to automatically track several key metrics: plays, watch time, demographic, and session completion.
The logic is handled without the need for manual event wiring or complex timers:
const analytics = connectCloudinaryAnalytics(videoElement);

analytics.startManualTracking({
  cloudName,
  publicId,
});
Code language: JavaScript (javascript)
Cloudinary manages heartbeats, session boundaries, and data aggregation. To ensure sessions close cleanly and all pending data is flushed, especially when swapping media or unmounting components, we’ll call stopManualTracking().
This approach is compatible with React and Next.js, because it avoids double-tracking issues during component remounts. At this stage, Cloudinary collects real engagement data on their servers.
Tracking is only half the job; you’ll still need to read and interpret the data. Cloudinary’s Video Analytics API uses basic authentication, requiring your API key and API secret.
You never want these secrets in the browser; even if you attempt to hide them, they can leak. To maintain security, we’ll fetch analytics from the server using a Next.js API route that acts as a safe proxy.
The communication flow works like this:
- The client calls
/api/analytics?publicId=.... - The server constructs a Base64-encoded
<api_key>:<api_secret>string for theAuthorizationheader. - The server calls Cloudinary’s analytics endpoint:
/video/analytics/views?expression=....
This architecture keeps your credentials server-only while allowing you to control timeouts, retries, and caching.
The main logic follows this secure pattern:
const url =
  `https://api.cloudinary.com/v1_1/${cloudName}/video/analytics/views` +
  `?expression=${encodeURIComponent(`video_public_id=${publicId}`)}`;

const res = await fetch(url, {
  headers: { Authorization: authHeader },
});
Code language: JavaScript (javascript)Real networks fail, so we’ll add robust guardrails to handle:
- Missing environment variables. Ensuring the API doesn’t run without proper configuration.
- Slow connections and random timeouts. Implementing manual timeout signals to prevent the server from hanging.
- Flaky outbound routes. Adding retries with backoff and keep-alive sockets to reduce failures, specifically for environments like Vercel where connection timeouts can occur.
The full server route lives here in the repo: https://github.com/musebe/video-insights-demo/blob/main/app/api/analytics/route.ts.
You can also find the full API documentation here: https://cloudinary.com/documentation/video_analytics.
Cloudinary returns analytics as raw “view rows” through its programmatic API. Each row represents an individual viewing session that has ended, provided in a structured data array.
The API response includes several critical fields that we use to build our creator insights:
-
view_watch_time. The total seconds a viewer spent on the video. -
viewer_location_country_code. The ISO country code of the viewer. -
viewer_application_name. The browser or app used (e.g., Chrome, Safari). -
viewer_os_identifier. Detailed operating system information. -
view_ended_at. The precise timestamp when the session finished.
Raw data can often be “noisy.” Sometimes we’ll see duplicates or sessions with a watch_time of zero, which occurs when a session starts but ends immediately or during rapid player testing. To ensure the dashboard tells an accurate story, we’ll perform three key normalization steps:
-
Sort by time. We sort data by
view_ended_atso the most recent interactions appear first, keeping the dashboard feeling “live”. - Deduplicate sessions. We’ll use a stable key by combining Public ID, End Time, Browser, OS, and Country, to identify duplicate heartbeats. If duplicates are found, we’ll retain the row with the higher watch time to ensure we don’t under-report engagement.
- Filter noise. While we keep most sessions, we can filter out extremely short bursts (zero-second views) if they clutter the visualization without adding value to the creator’s strategy.
The core logic utilizes a Map to deduplicate and then converts it back to a sorted array:
const map = new Map<string, CloudinaryView>();

for (const v of rows) {
  const key = [
    v.video_public_id,
    v.view_ended_at,
    v.viewer_application_name,
    v.viewer_location_country_code,
    v.viewer_os_identifier,
  ].join("|");

  const prev = map.get(key);

  // Keep the session with the most engagement data
  if (!prev || v.view_watch_time > prev.view_watch_time) {
    map.set(key, v);
  }
}

const cleaned = Array.from(map.values()).sort(
  (a, b) => +new Date(b.view_ended_at) - +new Date(a.view_ended_at)
);
Code language: JavaScript (javascript)
To keep the UI responsive without overloading the API, we’ll use careful polling that avoids overlapping requests or fast refresh loops. The full implementation of this logic can be explored in our dashboard source code.
Once the data is clean, the UI becomes simple. We’ll only show what helps a creator decide what to do next. The dashboard is organized into two layers.
The first layer provides quick signals numbers that can be checked in seconds to gauge performance:
-
Total views represents the total number of view sessions received, calculated directly from
data.length. -
Average watch time serves as a fast proxy for retention by averaging
view_watch_time. -
Countries: Identifies where viewers are located by mapping unique
viewer_location_country_codevalues.
The second layer reveals the story over time using an engagement timeline built with Recharts. Each point on the graph represents a single view session where the value is the view_watch_time.
To keep the UI focused, we’ll maintain a chart design with a minimal UI, but clean visualization to highlight engagement patterns and detailed tooltips that display the session timestamp.
The data mapping for the chart is straightforward:
const series = cleaned
  .slice()
  .reverse()
  .map((v, i) => ({
    n: i,
    s: v.view_watch_time || 0,
    t: new Date(v.view_ended_at).toLocaleString(),
  }));
Code language: JavaScript (javascript)
If watch time drops after a content change, or if a new “hook” successfully retains viewers, the trend is easy to read. Finally, we’ll include an “Insight Card”. It provides a friendly nudge based on the data:
-
Drop-off warning. If
avgWatch < 30, it warns the creator about early drop-offs. - Engagement signal. If the average is higher, it signals strong content resonance.
You can review the full dashboard implementation here: https://github.com/musebe/video-insights-demo/blob/main/app/dashboard/page.tsx.
- Real networks are messy. Production environments like Vercel can encounter outbound connection timeouts. We solved this by implementing AbortController signals and retries to ensure the dashboard remains stable even during network hiccups.
- Data cleaning is mandatory. Raw streams often contain “noise” from rapid testing or incomplete sessions. A small deduplication and sorting step prevents misleading vanity metrics and ensures the Average Watch Time represents real human engagement.
- Polling vs. SSE. Polling is a reliable starting point for near-real-time updates if managed with discipline (i.e., one request at a time every 15 to 30 seconds). For true “live” updates, Server-sent events (SSE) or WebSockets would be the natural next step.
- Simplicity wins. Creators don’t want 10 complex charts; they want to know if their new “hook” improved retention. Keeping the UI focused on drop-off points ensures the data is intuitive and actionable.
Analytics are only useful when actionable. Cloudinary provides the rich, raw “ingredients,” but it’s up to the developer to shape them into actionable signals for the creator. Sign up for Cloudinary to try it yourself today.
- Live Demo: https://video-insights-demo.vercel.app/
- Source Code: https://github.com/musebe/video-insights-demo
If you want to extend this project, here are some high-impact upgrades:
-
Pagination. Implement
next_cursorlogic to allow creators to load their full viewing history beyond the initial batch. - Advanced filtering. Add filters by Country, OS, or Browser to identify if content performs differently across demographics.
- Drop-off bucketing. Categorize views into “Buckets” (e.g., 0–3s, 3–10s, 30s+) to visualize exactly where the “leaky bucket” is in your content funnel.
-
A/B testing with
customData. Use Cloudinary’scustomDatatags to track two different versions of a video and see which one retains viewers longer.