Usage data
Last updated: Jan-21-2026
You can view reports that provide Assets-specific usage information. In addition, there are a few locations in the Cloudinary Console where you can view statistics, graphs, and other important information about your account usage in general.
Assets Admin Dashboard
You can view summary details and trend graphs to help you analyze your overall Assets usage in terms of total assets, collection activity, and uploads.
- Some Assets Enterprise accounts have Assets Reports instead of this Dashboard. If you'd like to upgrade from the Dashboard to Assets Reports, please contact your Customer Success Manager.
- These features aren't included in the Media Library available with the Assets Free plan, which offers basic management.
- To learn more about the features available in the Assets Free plan and how they can support development workflows, see Media Library for Developers.
- For upgrade options or more information, contact us.
- Only users with the Master admin role can access the dashboard.
- Data is cached and updated daily, so the newest information may not yet be reflected on the dashboard.
The following sections describe the metrics that are displayed on the dashboard.
Overview
Gain important insights into how your Assets product is being used:
| Metric | Description | Sample Insight |
|---|---|---|
| Assets | Total assets stored in your product environment and the distribution of those assets in terms of images, videos, and raw files. | If you have relatively few videos in storage, your presentation may benefit from increasing the number of videos you use. |
| Users | Total users and the number of users assigned to each role. | If you have a lot of administrators relative to Media Library users, you may not be following the best practice of having more Media Library users than administrators. |
| Collections and published collections | Total collections and the total number of assets they contain. You can also view the total number of published collections and total assets they contain. | If you have a relatively small number of published collections, your team may be using collections mostly for internal communication. |
| Live portals | Total live portals and the total number of assets they contain. | If you have a relatively small number of total assets, your team may tend to publish portals with a small number of assets. |
Total Views - Top 10
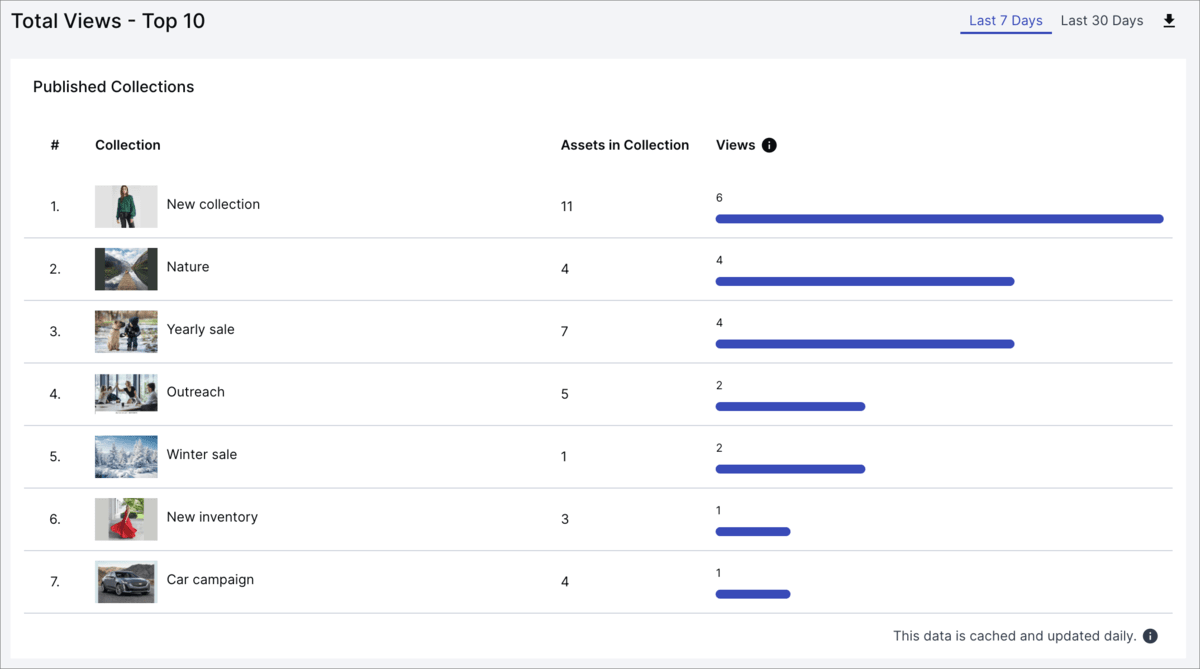
See which collections have been viewed the most in your selected product environment during a specified period of time, and find out which of your published collections are the most popular. (A single view consists of opening a collection and all actions performed in it until the collection is closed.)
On the dashboard itself, you can see the 10 collections with the most views. Click on a collection to open it for a closer look.
The downloaded version shows all published collections, ordered by greatest to least number of views.
Uploads
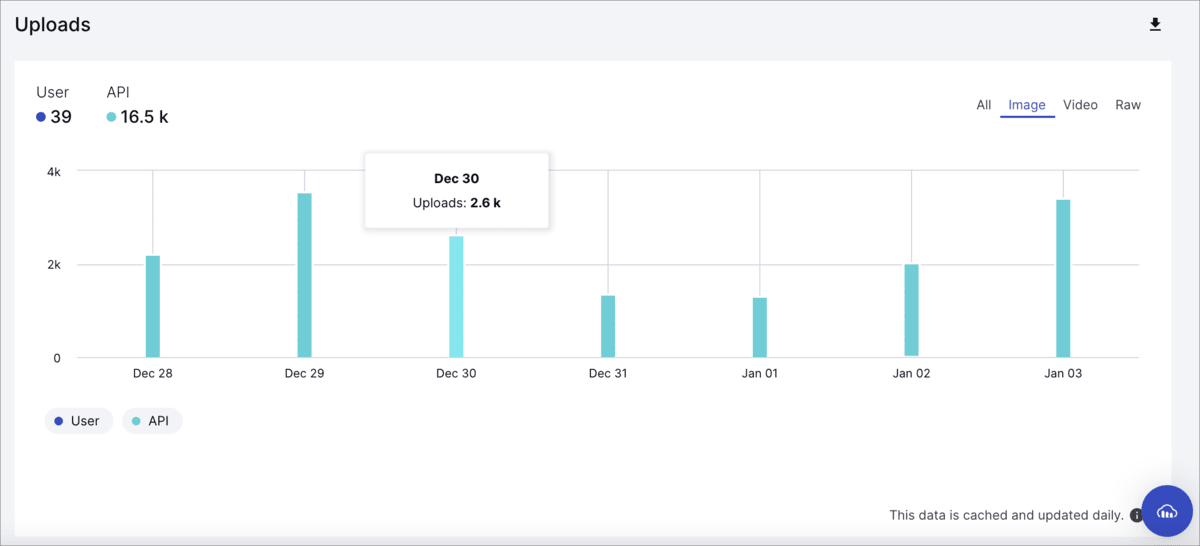
You can find out how many total uploads occurred in your product environment in the past 7 days, and how many uploads occurred on each day.
You can also filter that data to find out how many uploads occurred via API calls and by DAM users, and how many uploads occurred per asset type (image, video, or raw file). You can combine these filters can to get an even more granular picture. For example, you can find out how many image API uploads occurred on a specific day.
You can use this information to understand upload trends (for example, if video uploads increase per day, or are clustered around a certain period of time) and usage patterns (for example, if more uploads are performed by DAM users or via apps that use API calls).
Active Users - Top 10
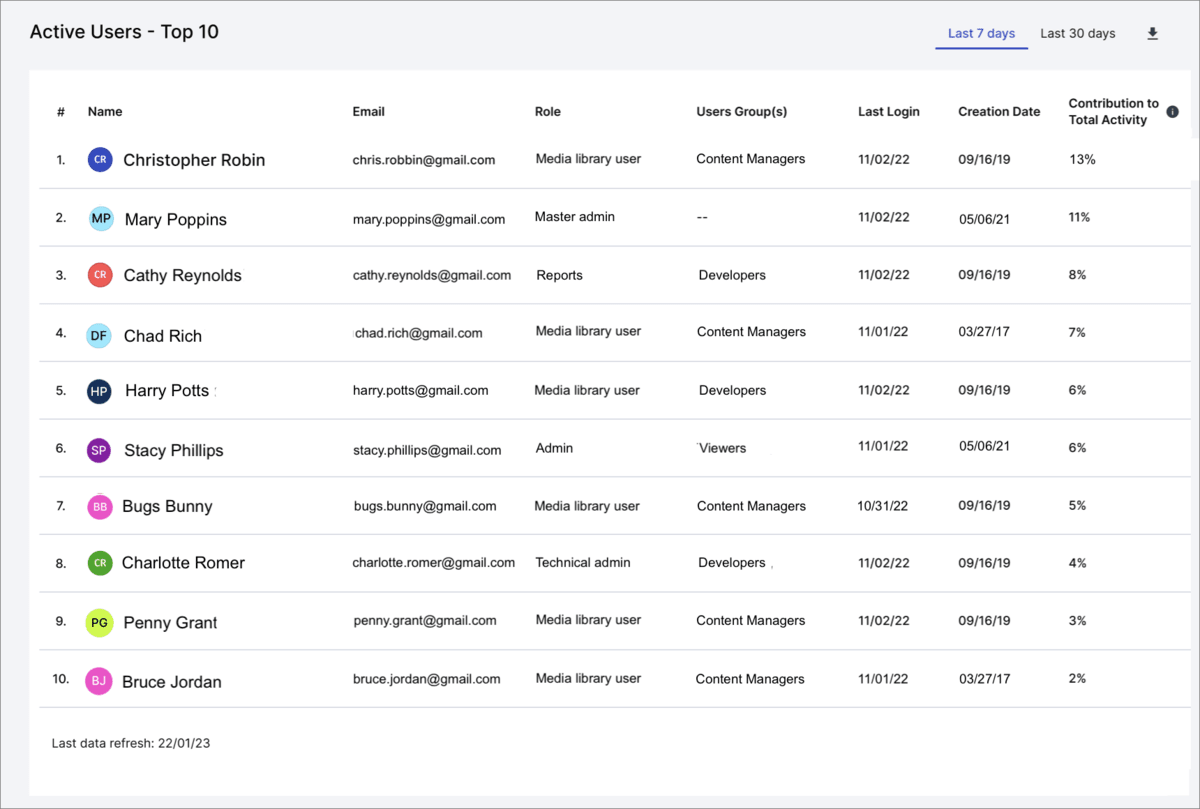
View summary information (e.g., email, role, associated user groups, last login date and date created) about the users that have been most active in the past 7 or 30 days in the selected product environment. In particular, you can view the percentage of the product environment's total activity attributed to each user.
On the dashboard itself, you can see the 10 most active users:
The downloaded version shows all users, ordered by most to least active.
Assets Activity Reports
You can generate a report that lists:
- All account management activities, for example user management and product environment management actions.
- All actions performed on tracking-enabled product environments, for example uploading and deleting assets, updating metadata, adding assets to collections, etc.
Assets Enterprise plans:
- The Activity Reports feature is a premium offering for the Assets product, and its availability depends on your account setup. If Activity Reports isn't yet enabled for your account and you'd like to activate it, please contact your Customer Success Manager.
Assets Free plan:
- This feature isn’t included in the Media Library available with the Assets Free plan, which offers basic management. It's part of the Media Library for Assets Enterprise plans.
- To learn more about the features available in the Assets Free plan and how they can support development workflows, see Media Library for Developers.
- For upgrade options or more information, contact us.
Use cases for this type of report include:
- Analyzing monthly asset usage.
- Finding more details about a known action, for example, which user deleted a certain asset.
- Auditing purposes.
Some considerations when generating your report:
- You can select a start and end date for the activities that will be included in your report. The actual start and end date aren't included in the report (only the dates in between).
- Generated reports will be available for up to 30 days.
- Up to 30 reports are saved at a time.
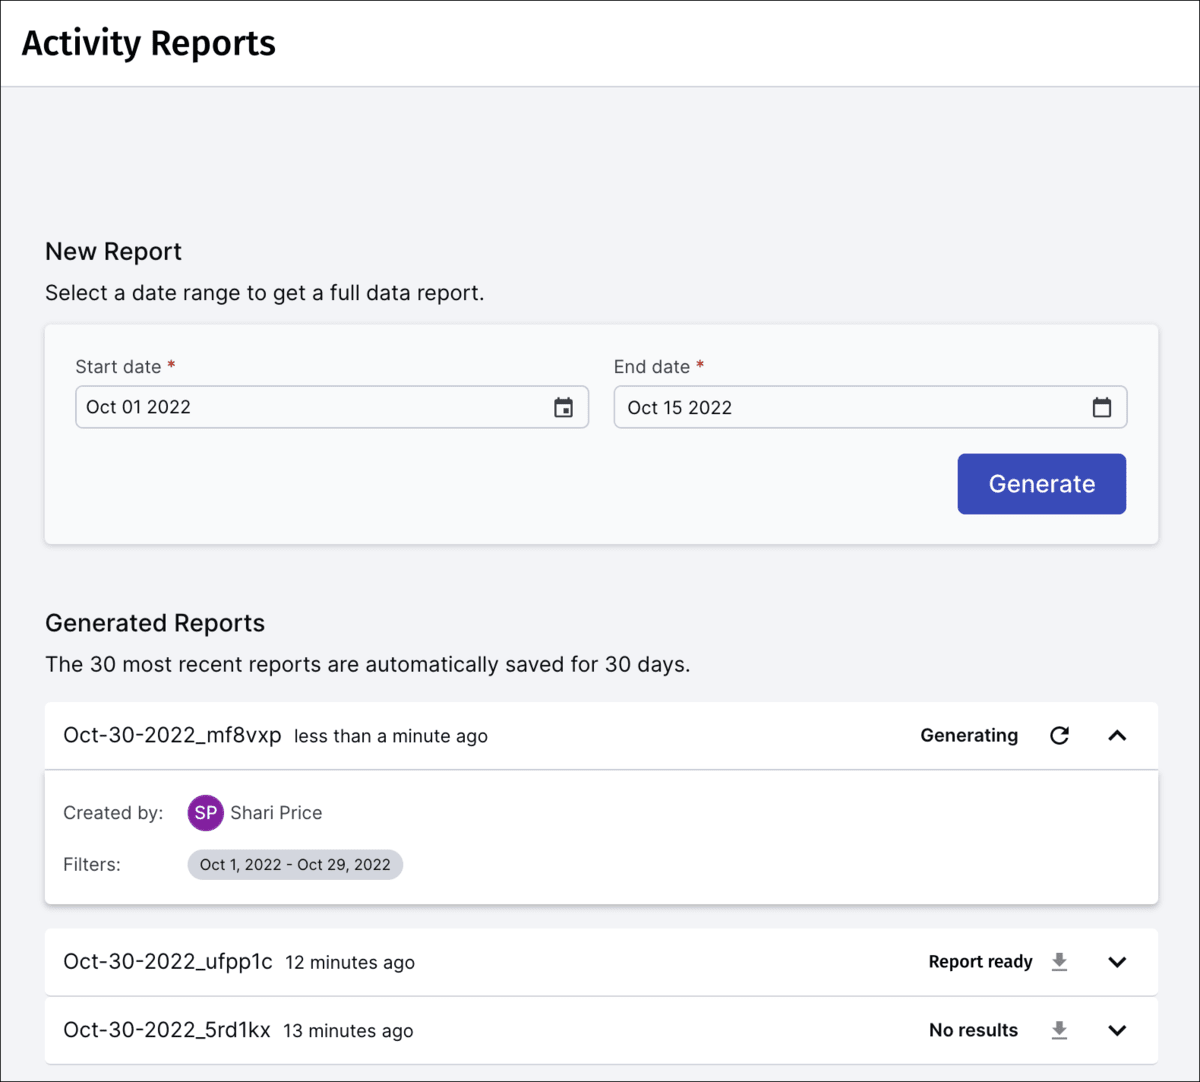
- It may take some time to generate a report. Feel free to continue your other Assets activities while the report is being generated, and check back later to see if the report is ready for download.
To generate an activity report:
- From the navigation pane, select Activity Reports.
- Select a date range and click Generate.NoteYour start date must be before your end date.
Account asset usage data
- To view additional information about asset usage throughout your account and selected product environment not specific to the Assets product (including summary details, trend graphs that break down usage in terms of impressions, delivered video seconds, transformations, total assets, used storage and bandwidth, etc), check the Usage Reports, Delivery Reports, and Error Reports available from the Home section of your Console.
- To sign up to receive the monthly account usage report by email, select that option in the Email Preferences tab of the My Profile Console Settings page.
For more information, see Account usage data.
 Ask AI


