
Images are a core part of how applications communicate information, from charts and visual reports to dynamic media and graphics. Developers often need to generate images programmatically rather than rely on static files. Python makes this possible with libraries that support drawing, compositing, and exporting images with just a few lines of code.
Creating images in Python is useful for data visualization, automated content generation, testing, and backend media workflows. You can produce everything from simple shapes to complex visuals and then store or deliver them as part of an application. Learning how to generate images programmatically helps teams build flexible systems that adapt quickly to changing requirements.
In this article:
- What It Means to Create an Image in Python
- Best Libraries for Creating Images in Python
- Drawing Shapes, Text, and Gradients
- Saving and Compressing Images: PNG, JPEG, and WebP
What It Means to Create an Image in Python
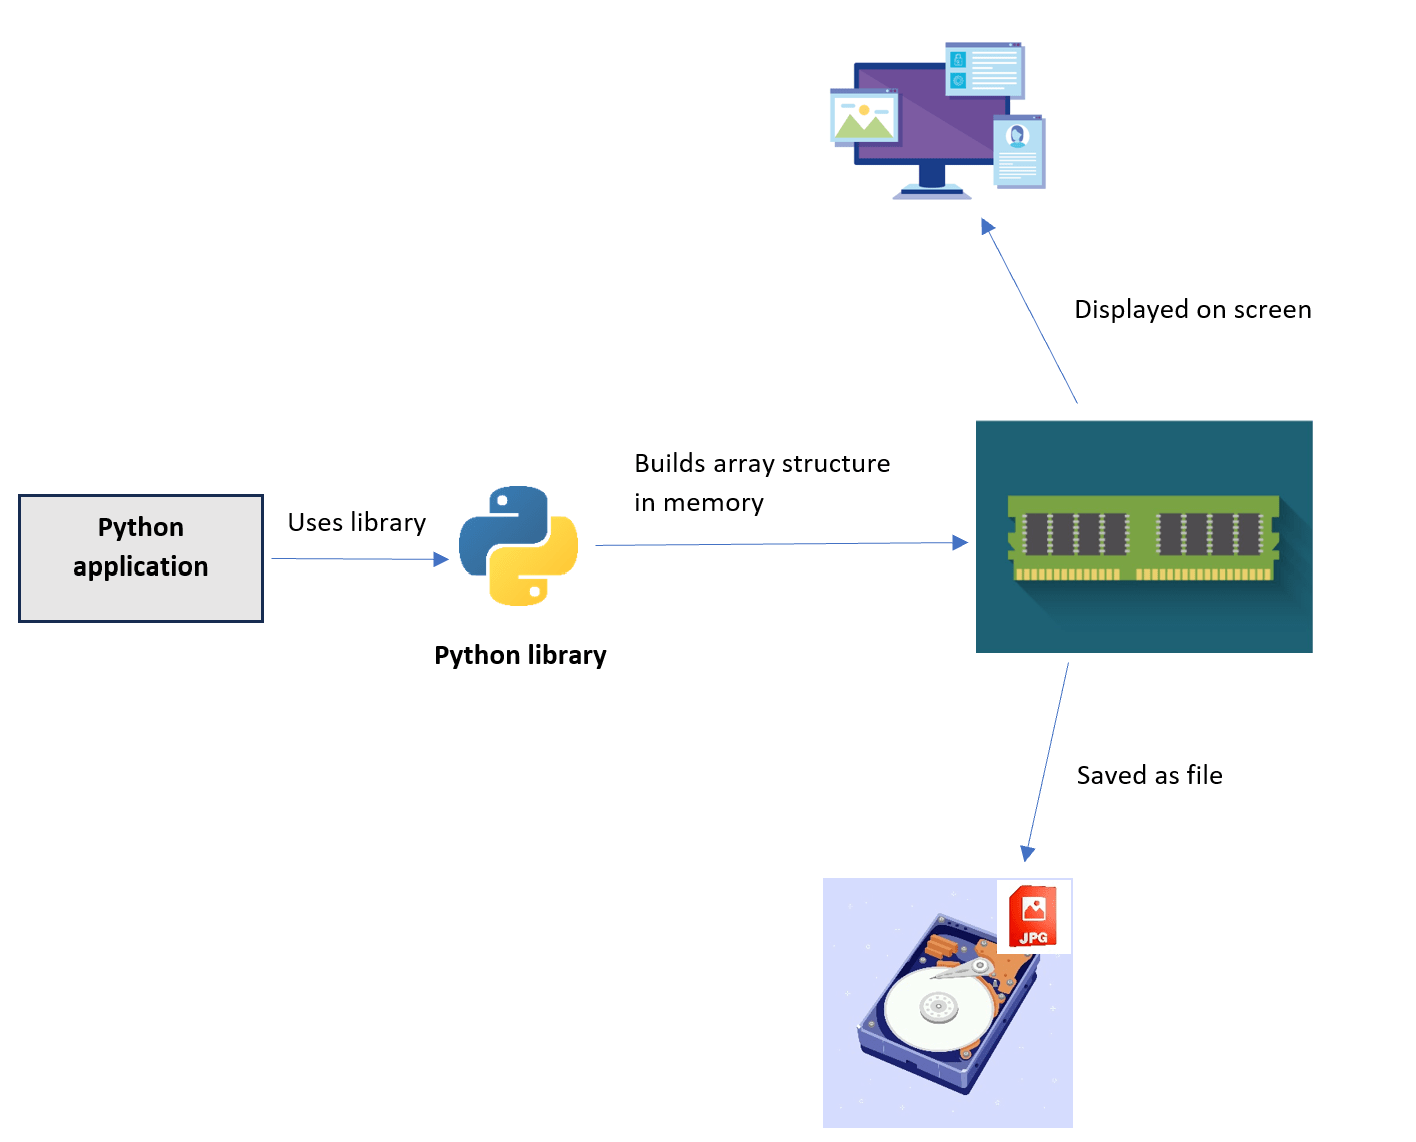
Images in Python are represented by a multi-dimensional array of values, these values carry the pixel data which reflect things like coloring, transparency, and maybe other pixel properties.
Creating an image in Python is the process of generating these values in memory using Python code. We can then view their corresponding visual representation of the image on the screen, or save it as an image file on persistent storage.
This image creation process is typically implemented through a Python library, which hides any underlying complexities and presents a simple interface that includes a set of objects and methods we can interact with to create and manipulate images.
Best Libraries for Creating Images in Python
Python has massive support for image processing and manipulation, and there are many libraries that are actively maintained and continuously improved to work with images. We’ll explore the most common libraries and see how to use each of them to create an image.
OpenCV
OpenCV represents images as a NumPy array, the dimensions of the array depend on whether the image is colored (3D array) or grayscale (2D array). The first two dimensions of the array are the height and width of the image, if the image is grayscale, then the value of each index in the array is the gray level of that pixel, which is an integer between 0 and 255.
If the image is colored, the third dimension of the array will represent the 3 color channels, or 4 channels in case of an alpha channel for transparency. Color channels in OpenCV follow the BGR format, which is unlike most other libraries that use RGB.
Now enough for the theory, let’s see how to use OpenCV in practice to create an image.
First you’ll need to install the OpenCV and NumPy libraries with pip install opencv-python
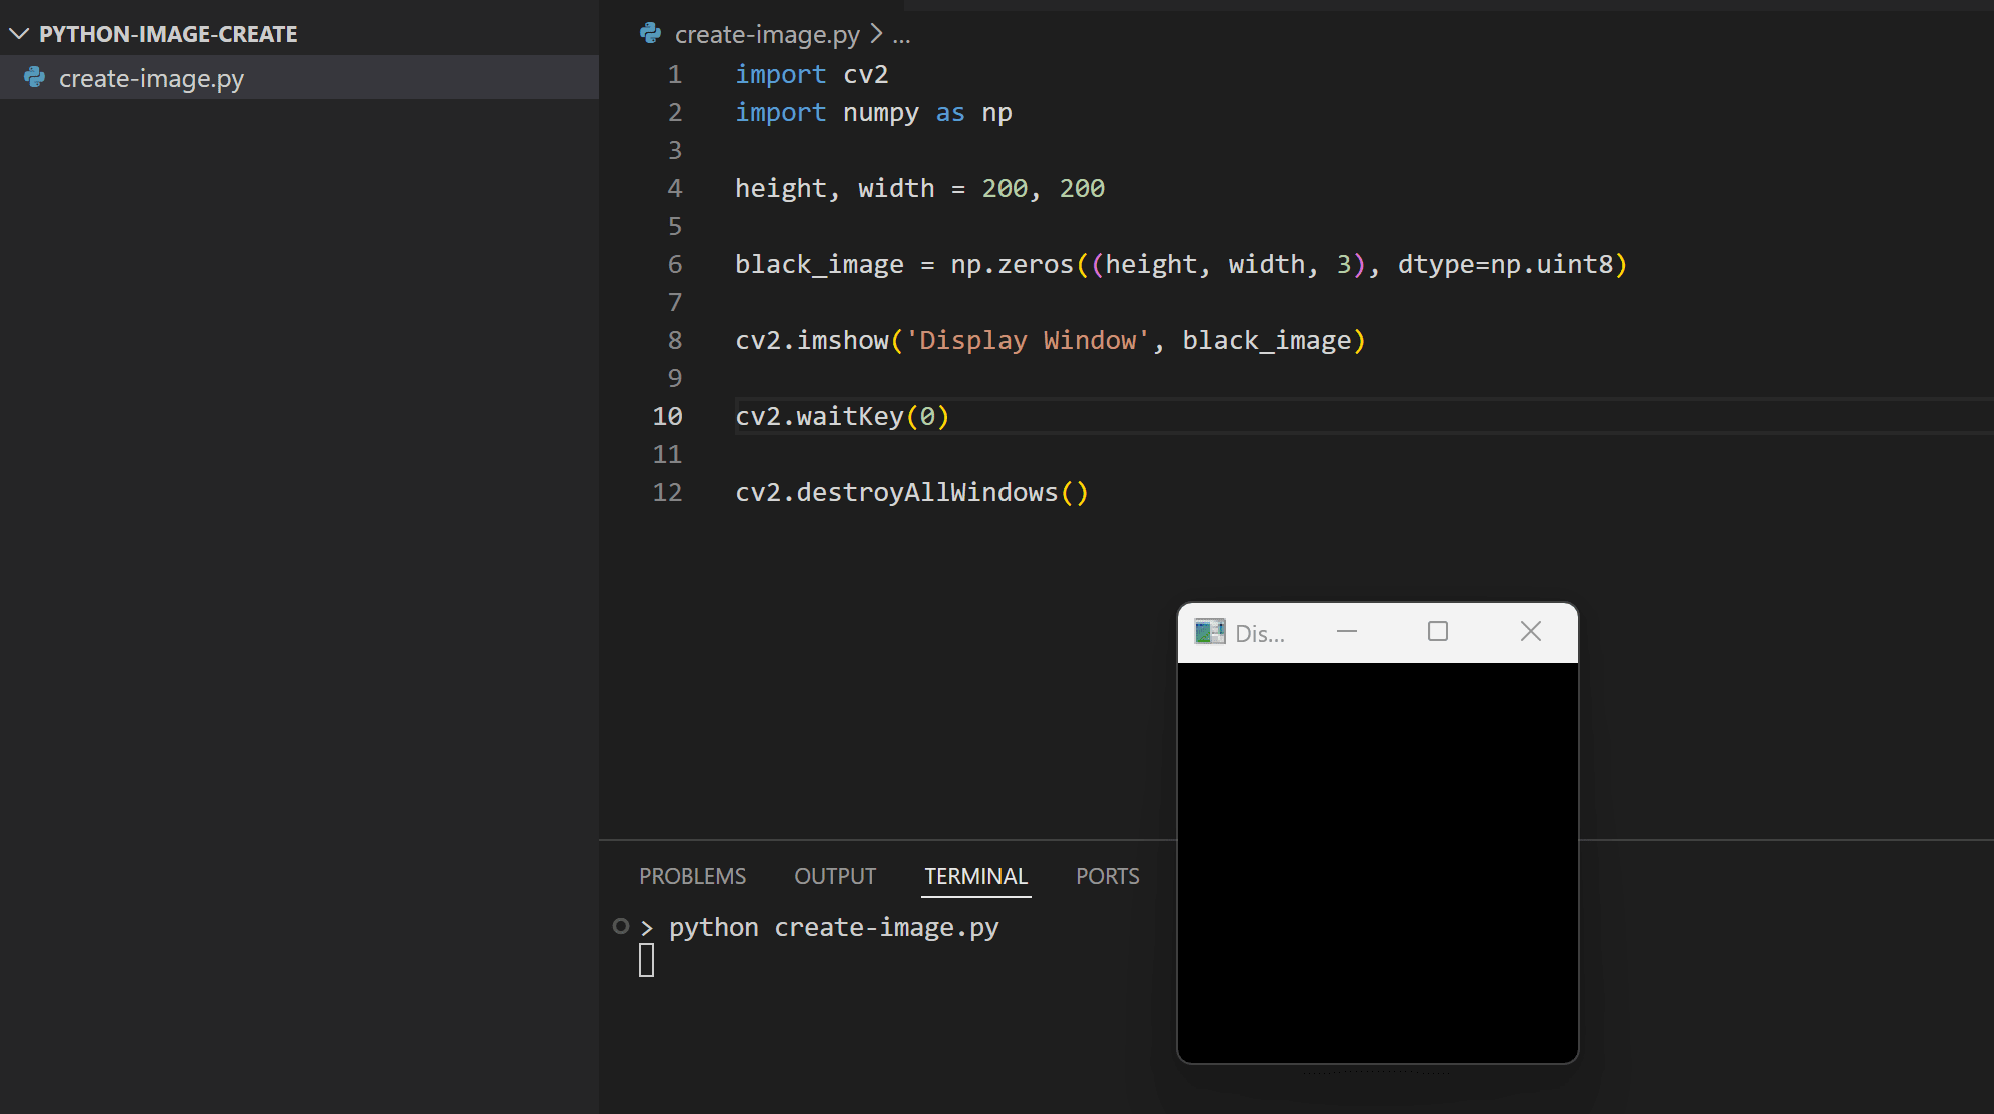
This command will install the OpenCV library which will automatically include NumPy. We can then create an image and display it with the following code:
import cv2
import numpy as np

height, width = 200, 200

black_image = np.zeros((height, width, 3), dtype=np.uint8)

cv2.imshow('Display Window', black_image)

cv2.waitKey(0)

cv2.destroyAllWindows()
Here, we:
- Create a new image with 200*200 dimensions.
- The
np.zeros()method creates an array with all the values set to zero, and the data type of each element in the array is uint8. This will set the BGR values to zeros, creating a black image. - Then we display it using the
imshow()method:
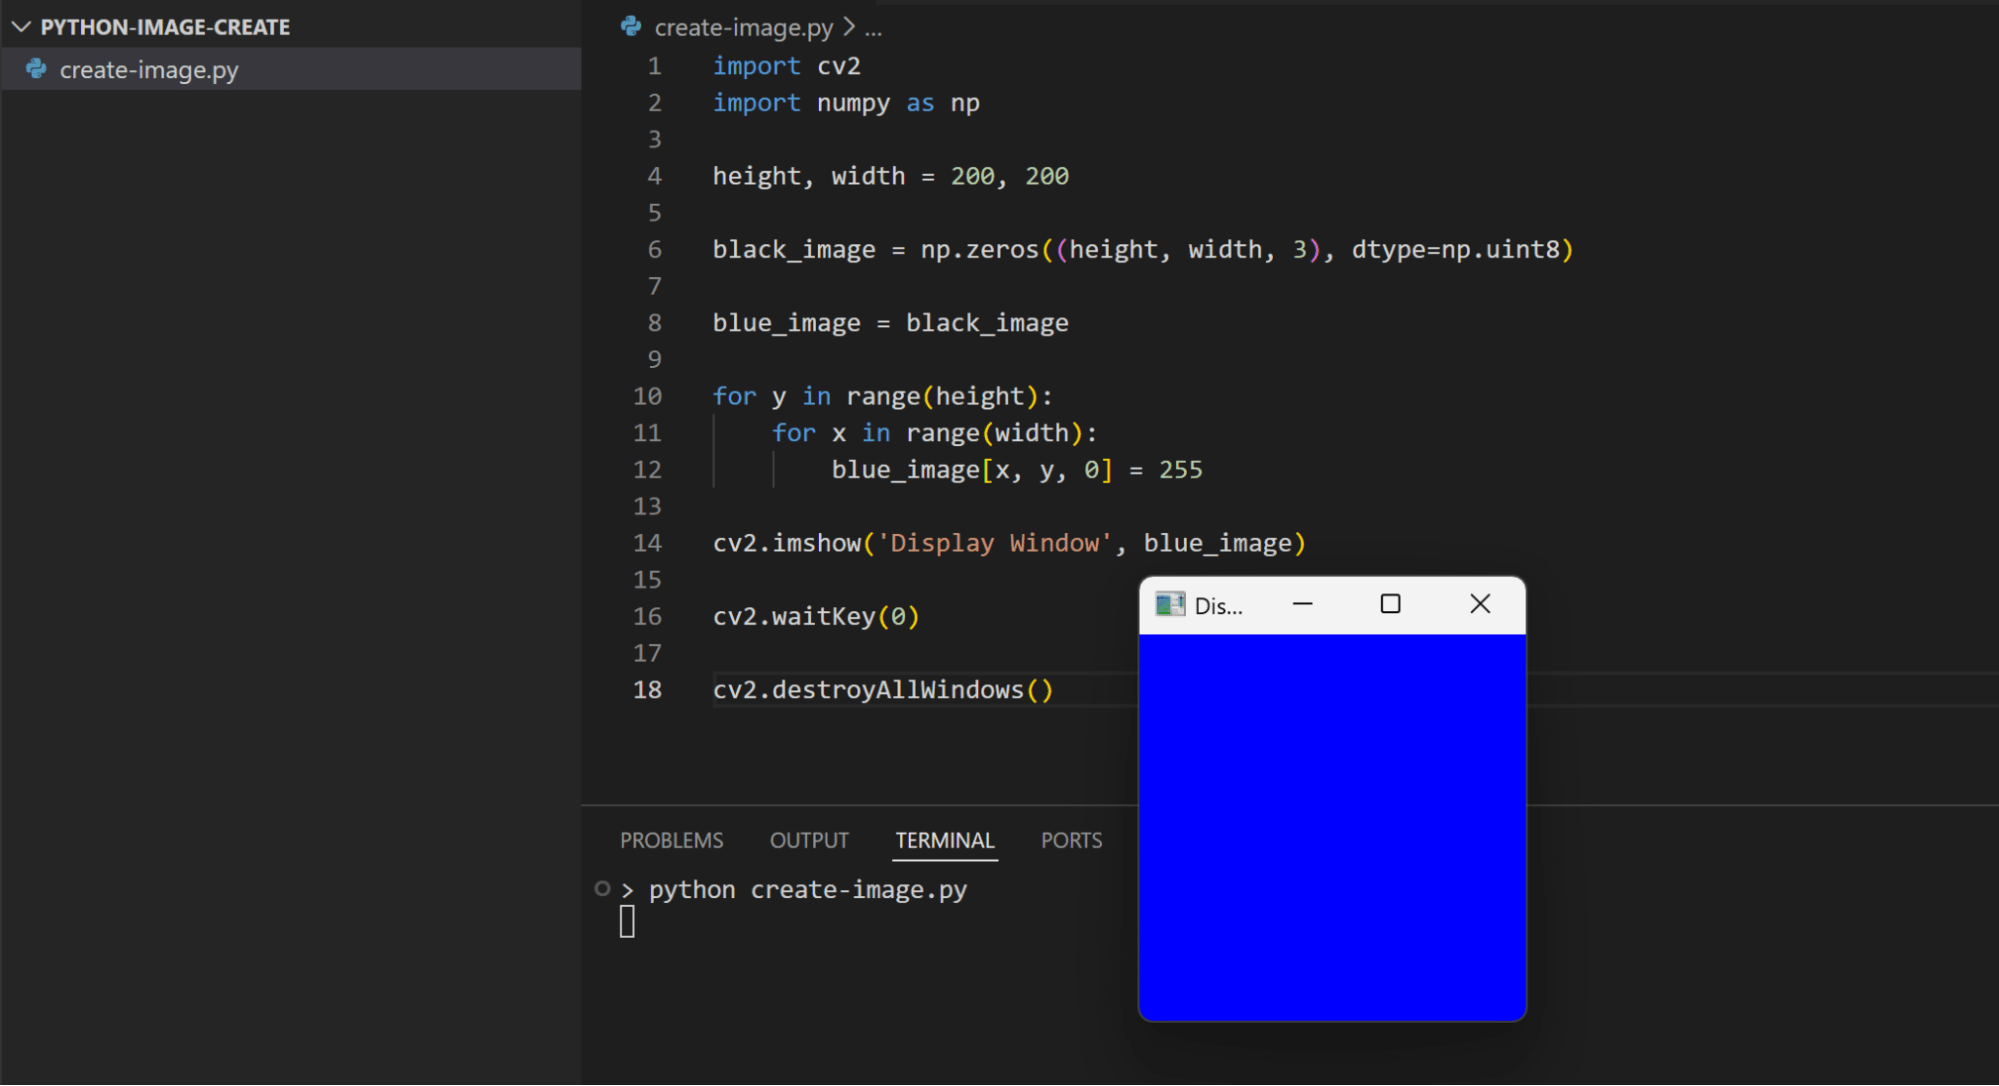
We can manipulate this image by modifying the values of the created array. For example, we can change the image color by setting the desired BGR color values:
import cv2
import numpy as np

height, width = 200, 200

black_image = np.zeros((height, width, 3), dtype=np.uint8)

blue_image = black_image

for y in range(height):
    for x in range(width):
        blue_image[x, y, 0] = 255

cv2.imshow('Display Window', blue_image)

cv2.waitKey(0)

cv2.destroyAllWindows()
Pillow
Pillow represents images a bit different than OpenCV. In Pillow, each image is a grid of two dimensional array where each element in the array represents a pixel. The image information is stored as part of an Image object.
This Image object also has an attribute that represents a specific image “mode”. The most common modes are RGB for colored images, RGBA images with an alpha channel for transparency, and L or luminous mode for grayscale images. The image mode decides how each pixel information is represented.
For example, in RGB mode, a pixel is represented by a 3-tuple with each value in the tuple corresponding to the red, green, or blue color level. In the RGBA mode the pixel is a 4-tuple with the fourth element representing the alpha channel or transparency level. In the L mode, a pixel is represented by only an integer value that corresponds to the luminous degree of the pixel.
To use the Pillow library, you first need to install it via pip install Pillow
Then you can create an image with the Image.new() method as follows:
from PIL import Image

white_img = Image.new("RGB", (200, 200), (255, 255, 255))

white_img.show()
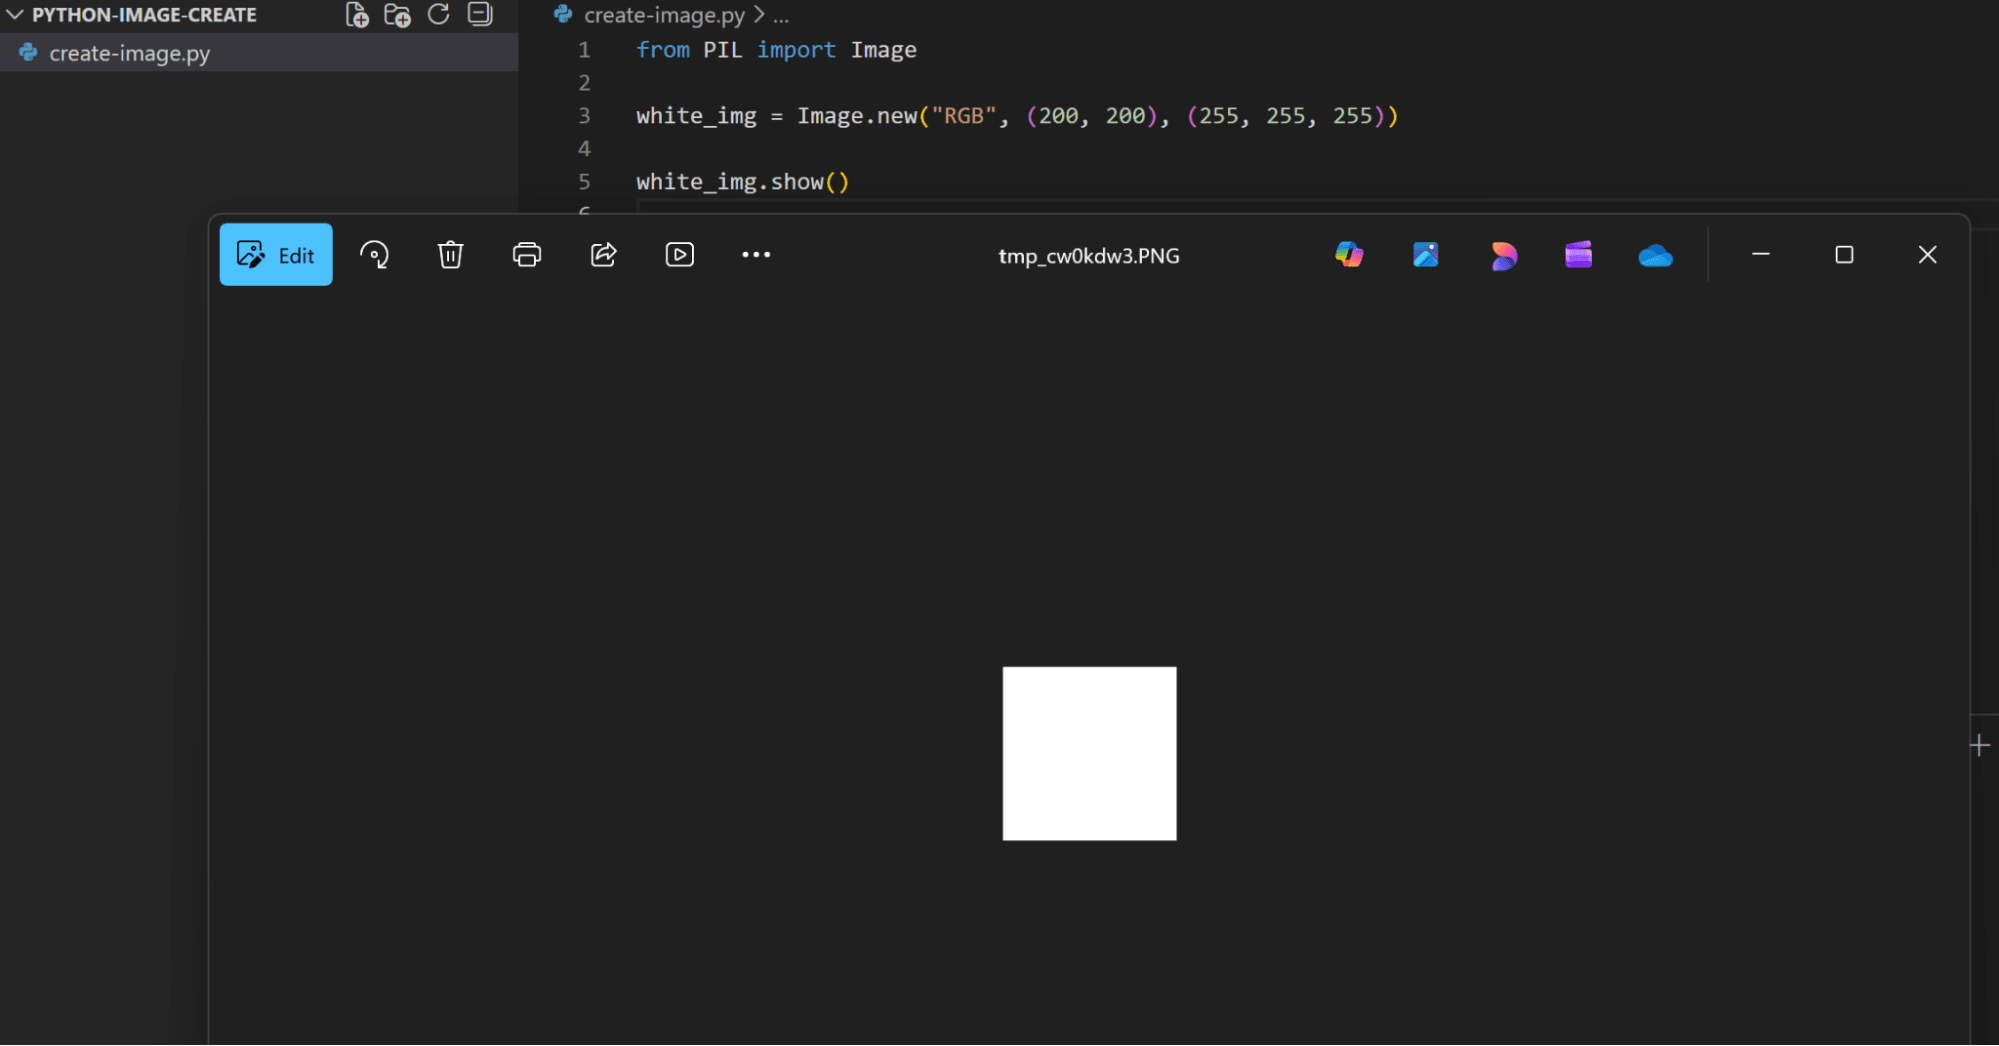
As we can see, creating a basic image with Pillow is relatively simple with few code lines. The Image.new() method takes as a parameter the image mode, the image dimensions as a 2-tuple, and optionally the pixel color values you want to set for the image. Because we’re using an RGB mode, the pixel color is provided as a 3-tuple. The 255 value for RGB means all the pixels will have the white color:
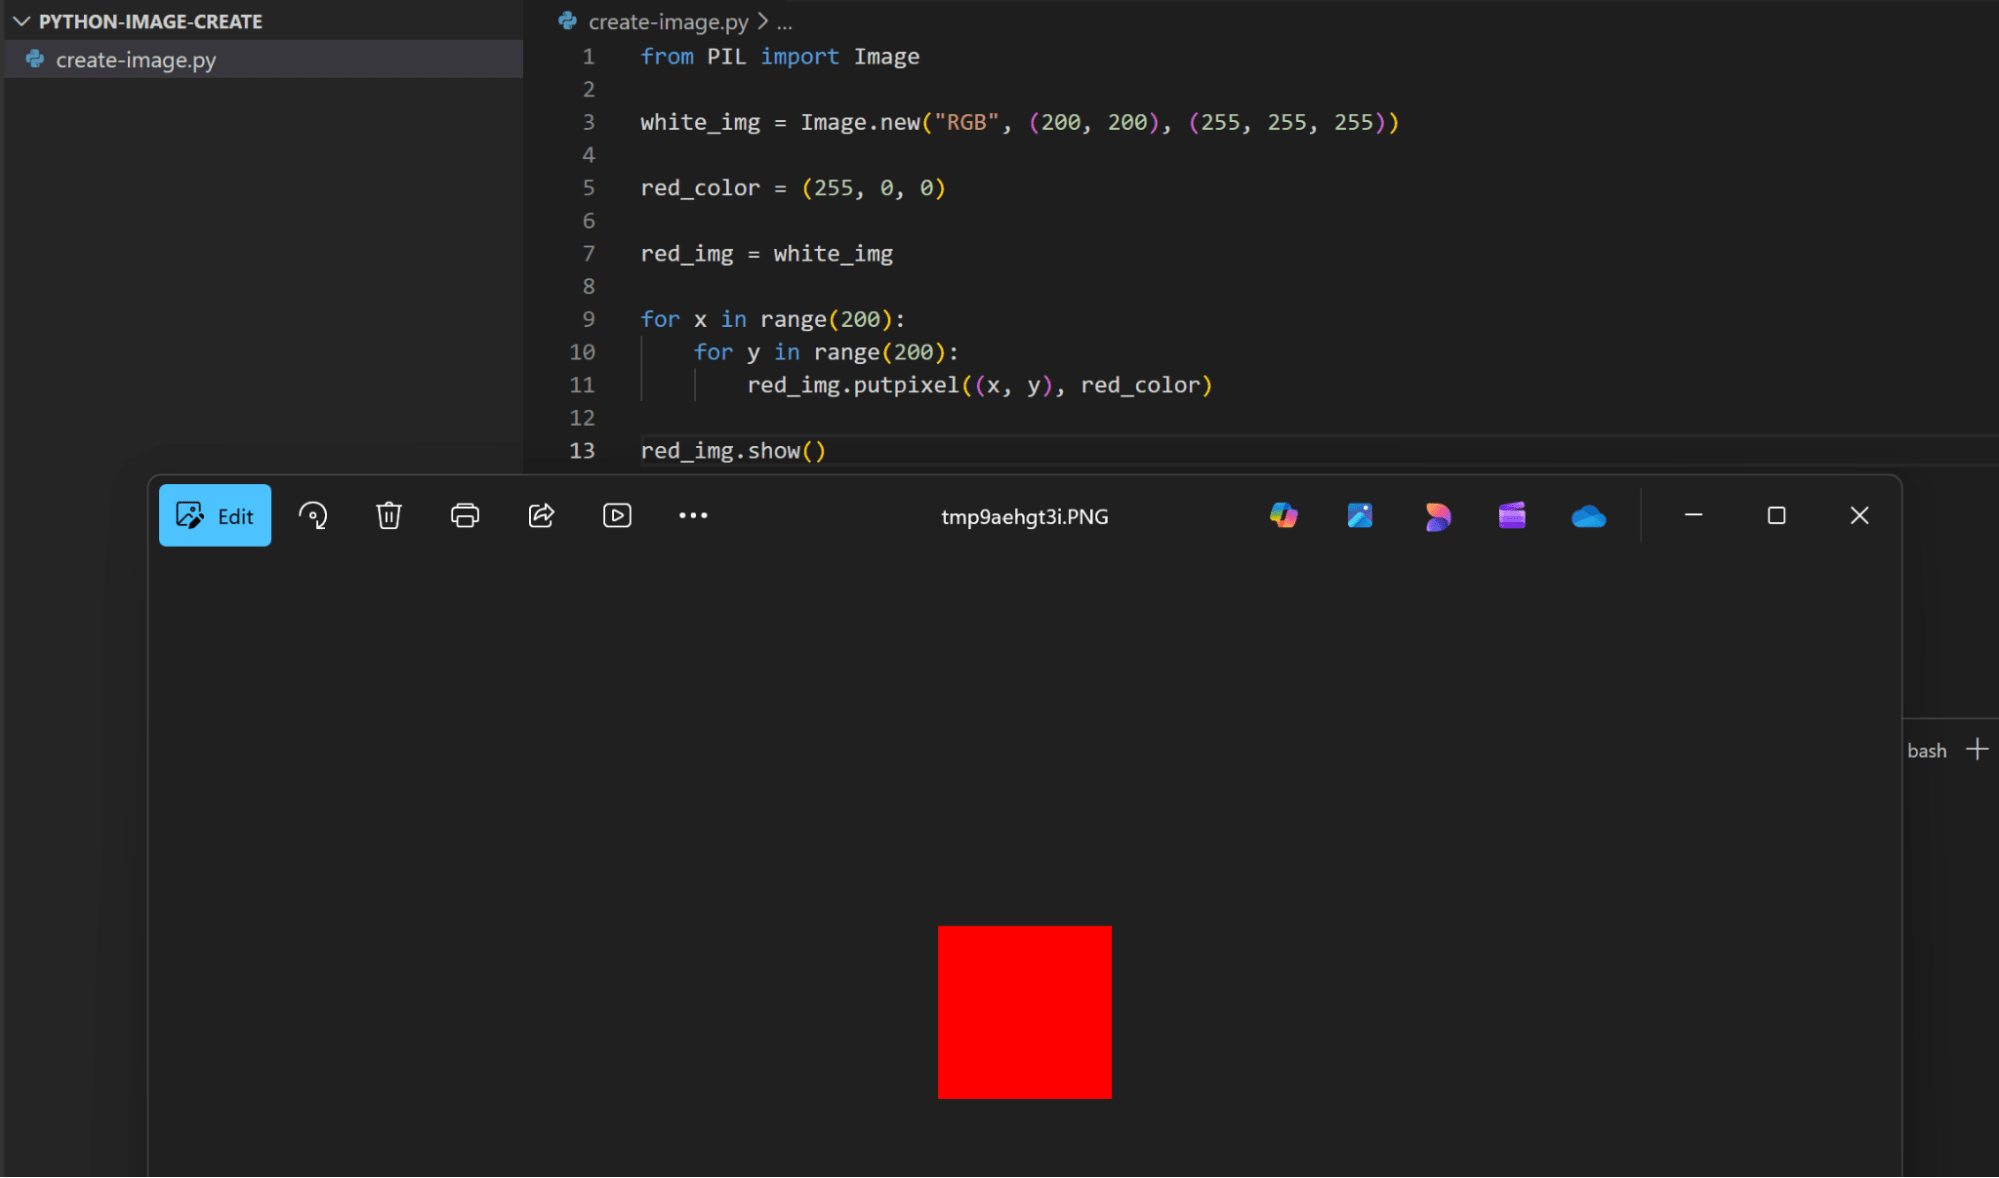
We can also modify the image color by setting a different 3-tuple value for all the pixels using the putpixel() method:
from PIL import Image

white_img = Image.new("RGB", (200, 200), (255, 255, 255))

red_color = (255, 0, 0)

red_img = white_img

for x in range(200):
    for y in range(200):
        red_img.putpixel((x, y), red_color)

red_img.show()
Matplotlib
The Matplotlib represents images similar to OpenCV. It uses NumPy arrays for storing the pixel information.
A grayscale image is represented as a 2D array where each element is a single integer value between 0 and 255 that corresponds to the luminous degree of that pixel. A colored image is represented as a 3D array, where the third dimension is the image channels which can be RGB or RGBA. Matplotlib can represent pixel values not only as integers between 0 and 255, but also as floats ranging from 0.0 to 1.0.
As usual, start with installing the Matplotlib and NumPy libraries with pip install matplotlib numpy
Then you can create an image by initializing a NumPy array and using its data:
import numpy as np
import matplotlib.pyplot as plt

image_height = 200
image_width = 200

my_image = np.zeros((image_height, image_width), dtype=np.uint8)

for x in range(image_width):
    for y in range(image_height):
        my_image[x][y] = 123

plt.imshow(my_image, cmap='gray', vmin=0, vmax=255)
plt.axis('off')
plt.show()
plt.close()
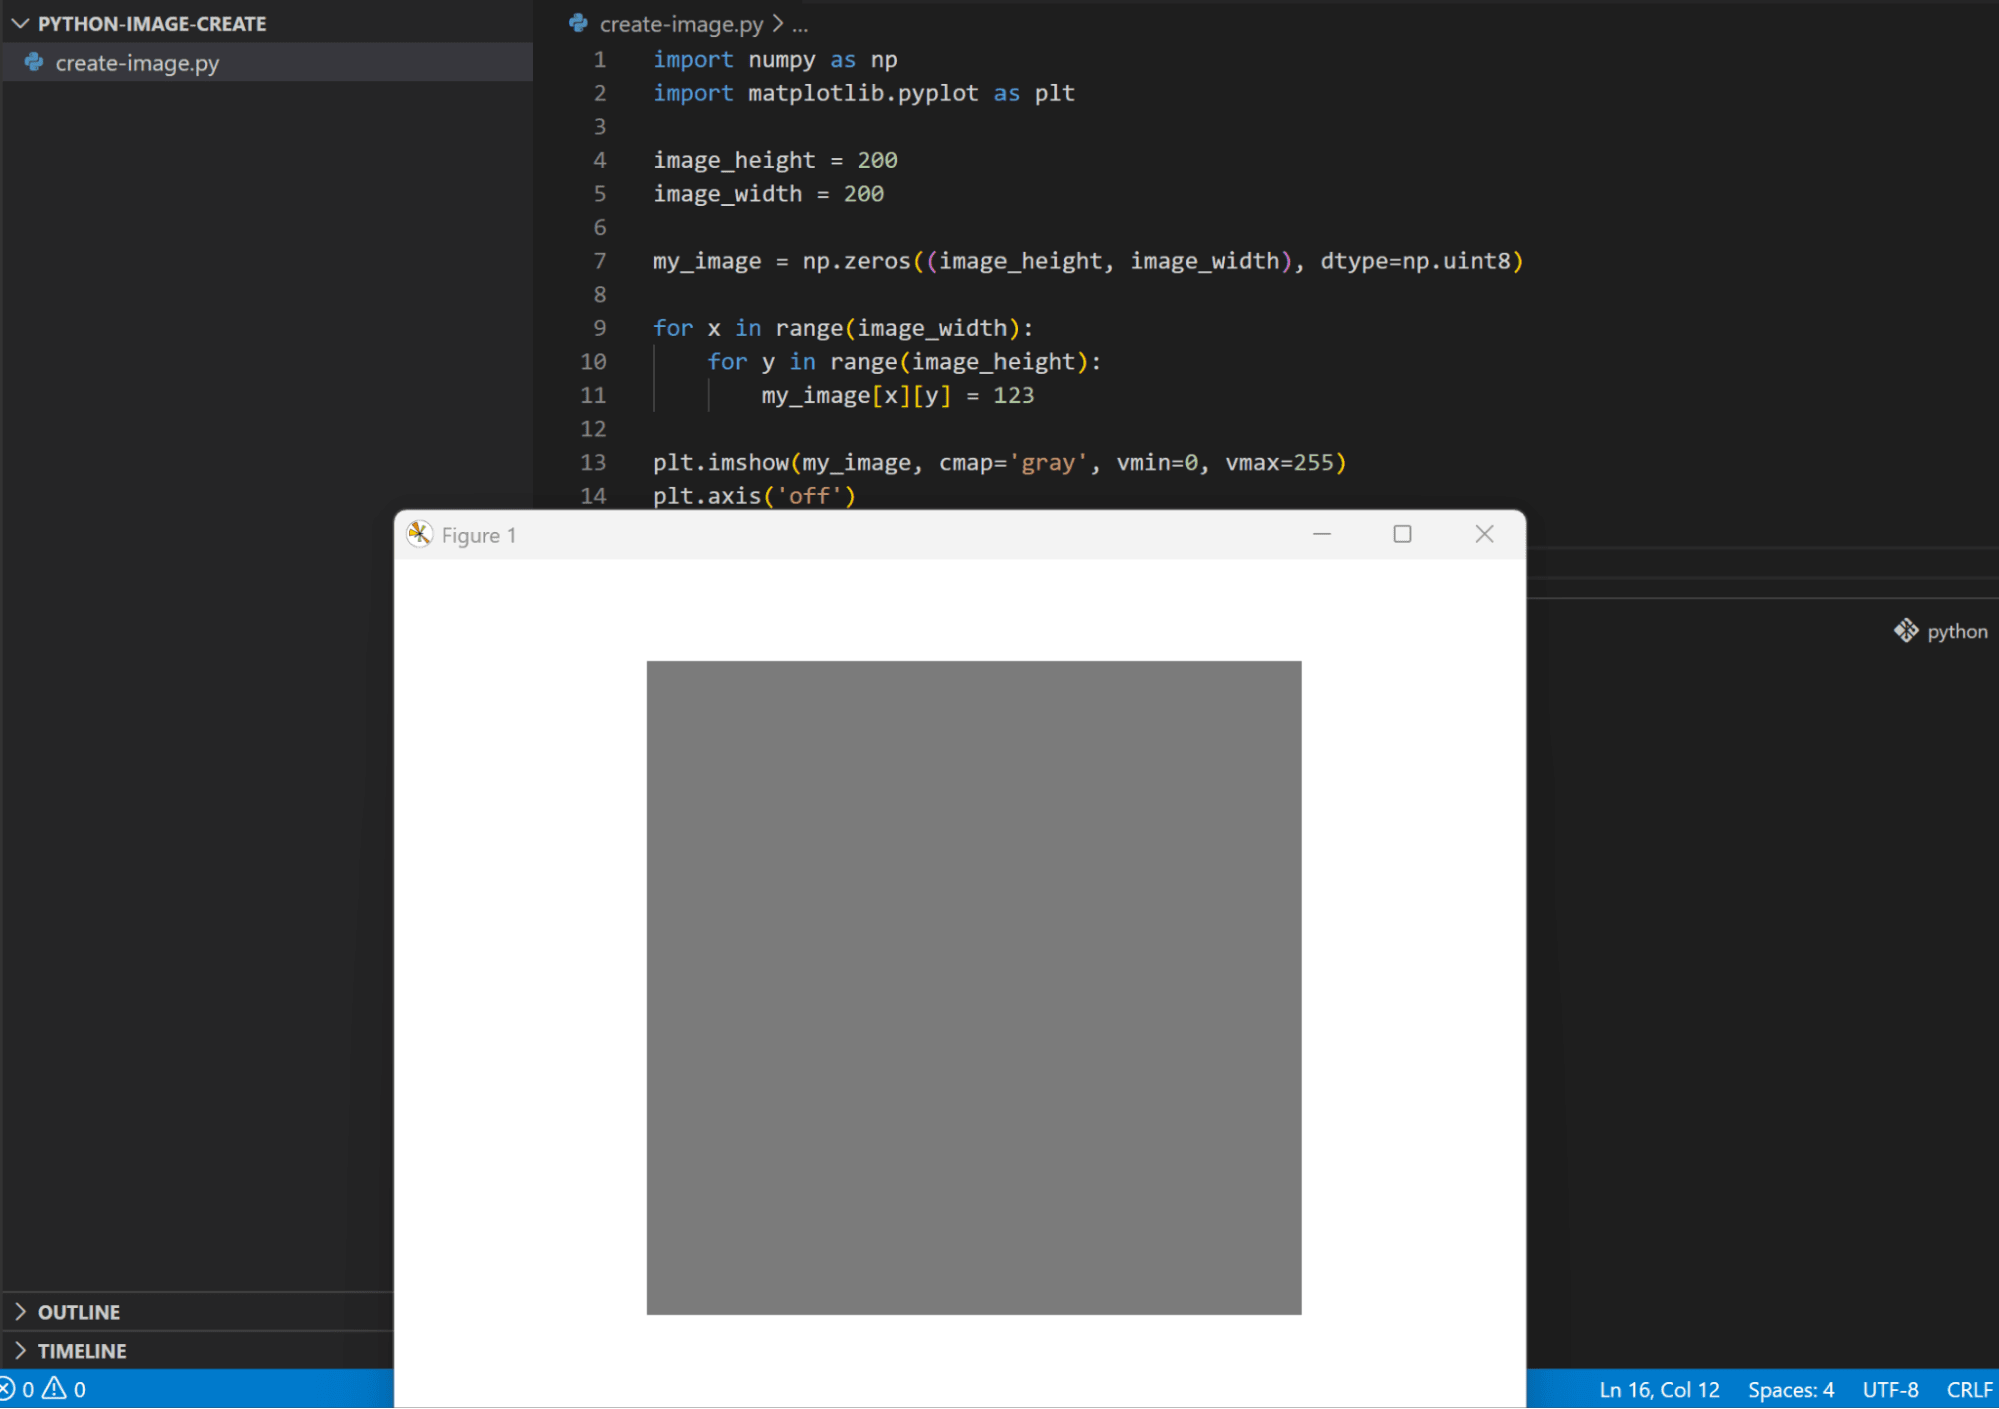
Here we create a 2D array for a grayscale image. We initialize the array values with zeros using the np.zeros() method, then we modify the values and set it to 123, which corresponds to the gray level color of each pixel:
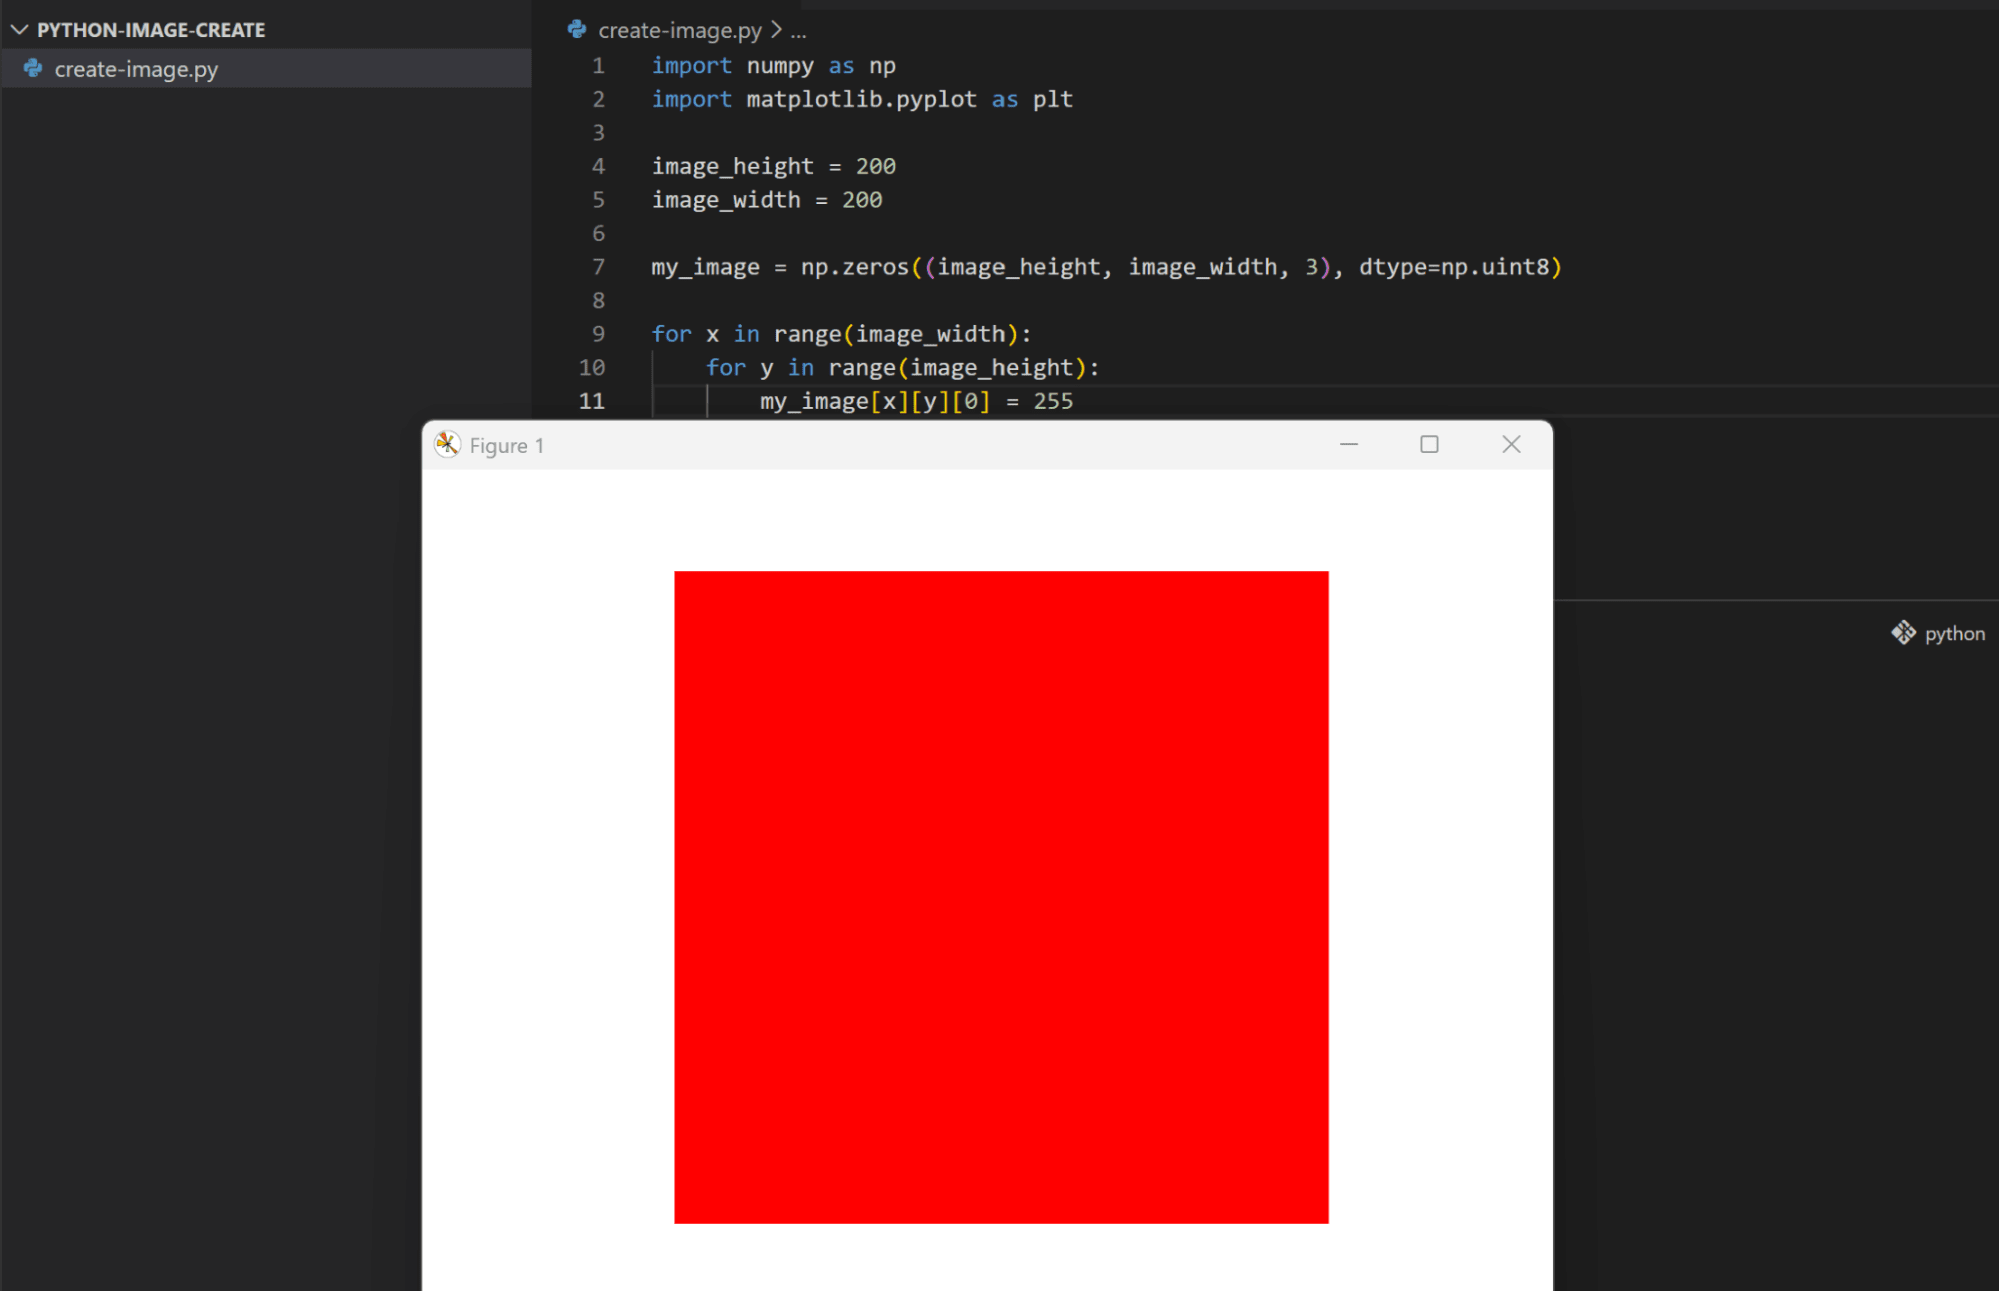
We can change it to a colored image by adding a third dimension when creating the NumPy array and set the color level of each channel (RGB) in this dimension:
import numpy as np
import matplotlib.pyplot as plt

image_height = 200
image_width = 200

my_image = np.zeros((image_height, image_width, 3), dtype=np.uint8)

for x in range(image_width):
    for y in range(image_height):
        my_image[x][y][0] = 255

plt.imshow(my_image)
plt.axis('off')
plt.show()
plt.close()
Drawing Shapes, Text, and Gradients
After we’ve created an image, let’s see how we can draw other objects and display them on the screen. Using the Python libraries we covered before, we can create shapes, text, and apply color gradients. For our examples, we’ll use the OpenCV library.
Draw Shapes
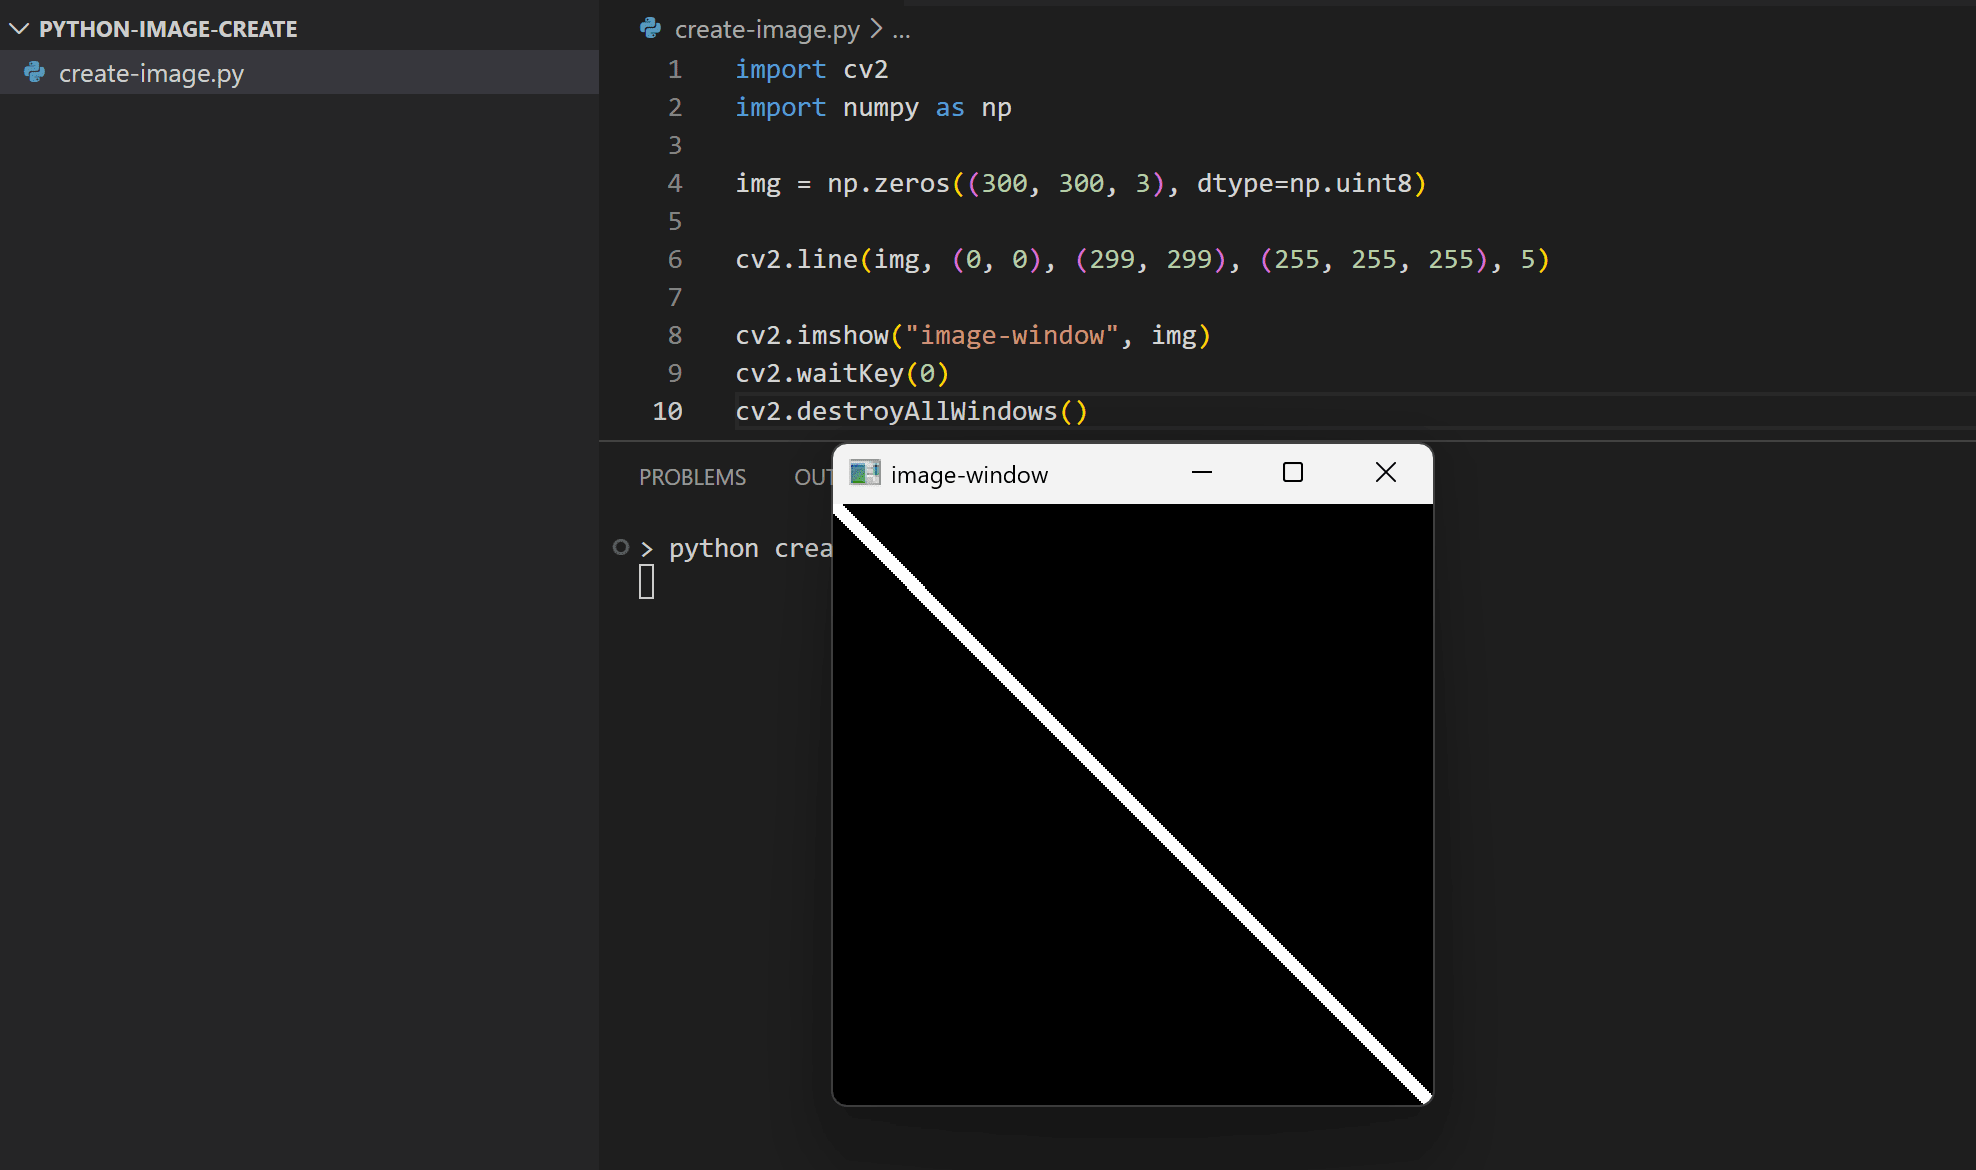
We’ll start by drawing a simple line shape. First we need to create a colored image, then we’ll specify the shape type and properties to be drawn within this image space:
import cv2
import numpy as np

img = np.zeros((300, 300, 3), dtype=np.uint8)

cv2.line(img, (0, 0), (299, 299), (255, 255, 255), 5)

cv2.imshow("image-window", img)
cv2.waitKey(0)
cv2.destroyAllWindows()
In the above code, we:
- Use the
cv2.line()method to specify the shape type as a line. - Provide the parameters for:
- Which image space it will be drawn inside
- Starting and ending coordinates
- Color in BGR format
- Thickness.
The information we provided here will draw a diagonal line that starts from the top-left of the image (0, 0) and ends at the bottom-right (0, 0) with a white color (255, 255, 255):
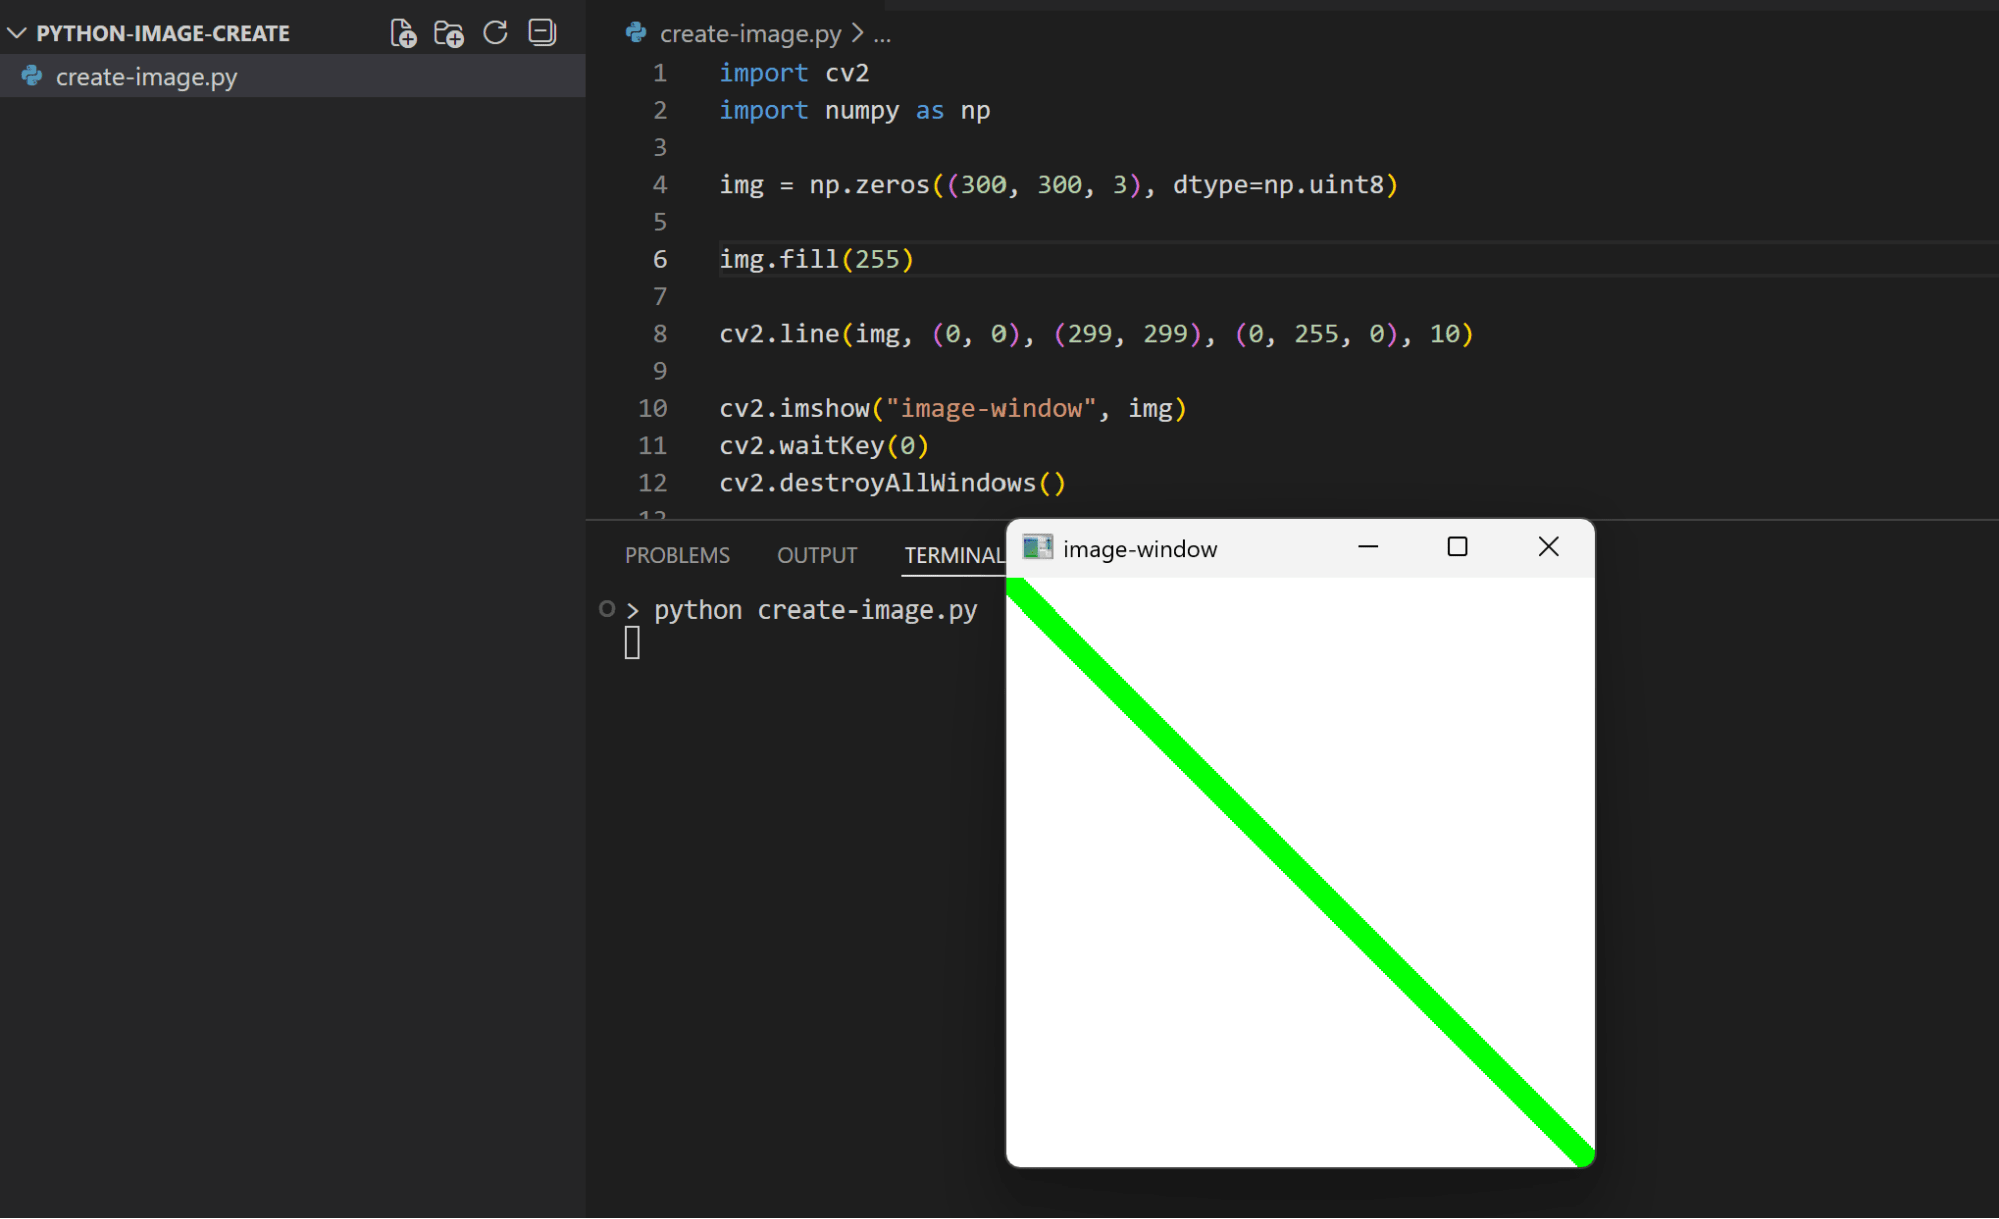
And we can manipulate the background image and line values to change how it looks:
import cv2
import numpy as np

img = np.zeros((300, 300, 3), dtype=np.uint8)

img.fill(255)

cv2.line(img, (0, 0), (299, 299), (0, 255, 0), 10)

cv2.imshow("image-window", img)
cv2.waitKey(0)
cv2.destroyAllWindows()
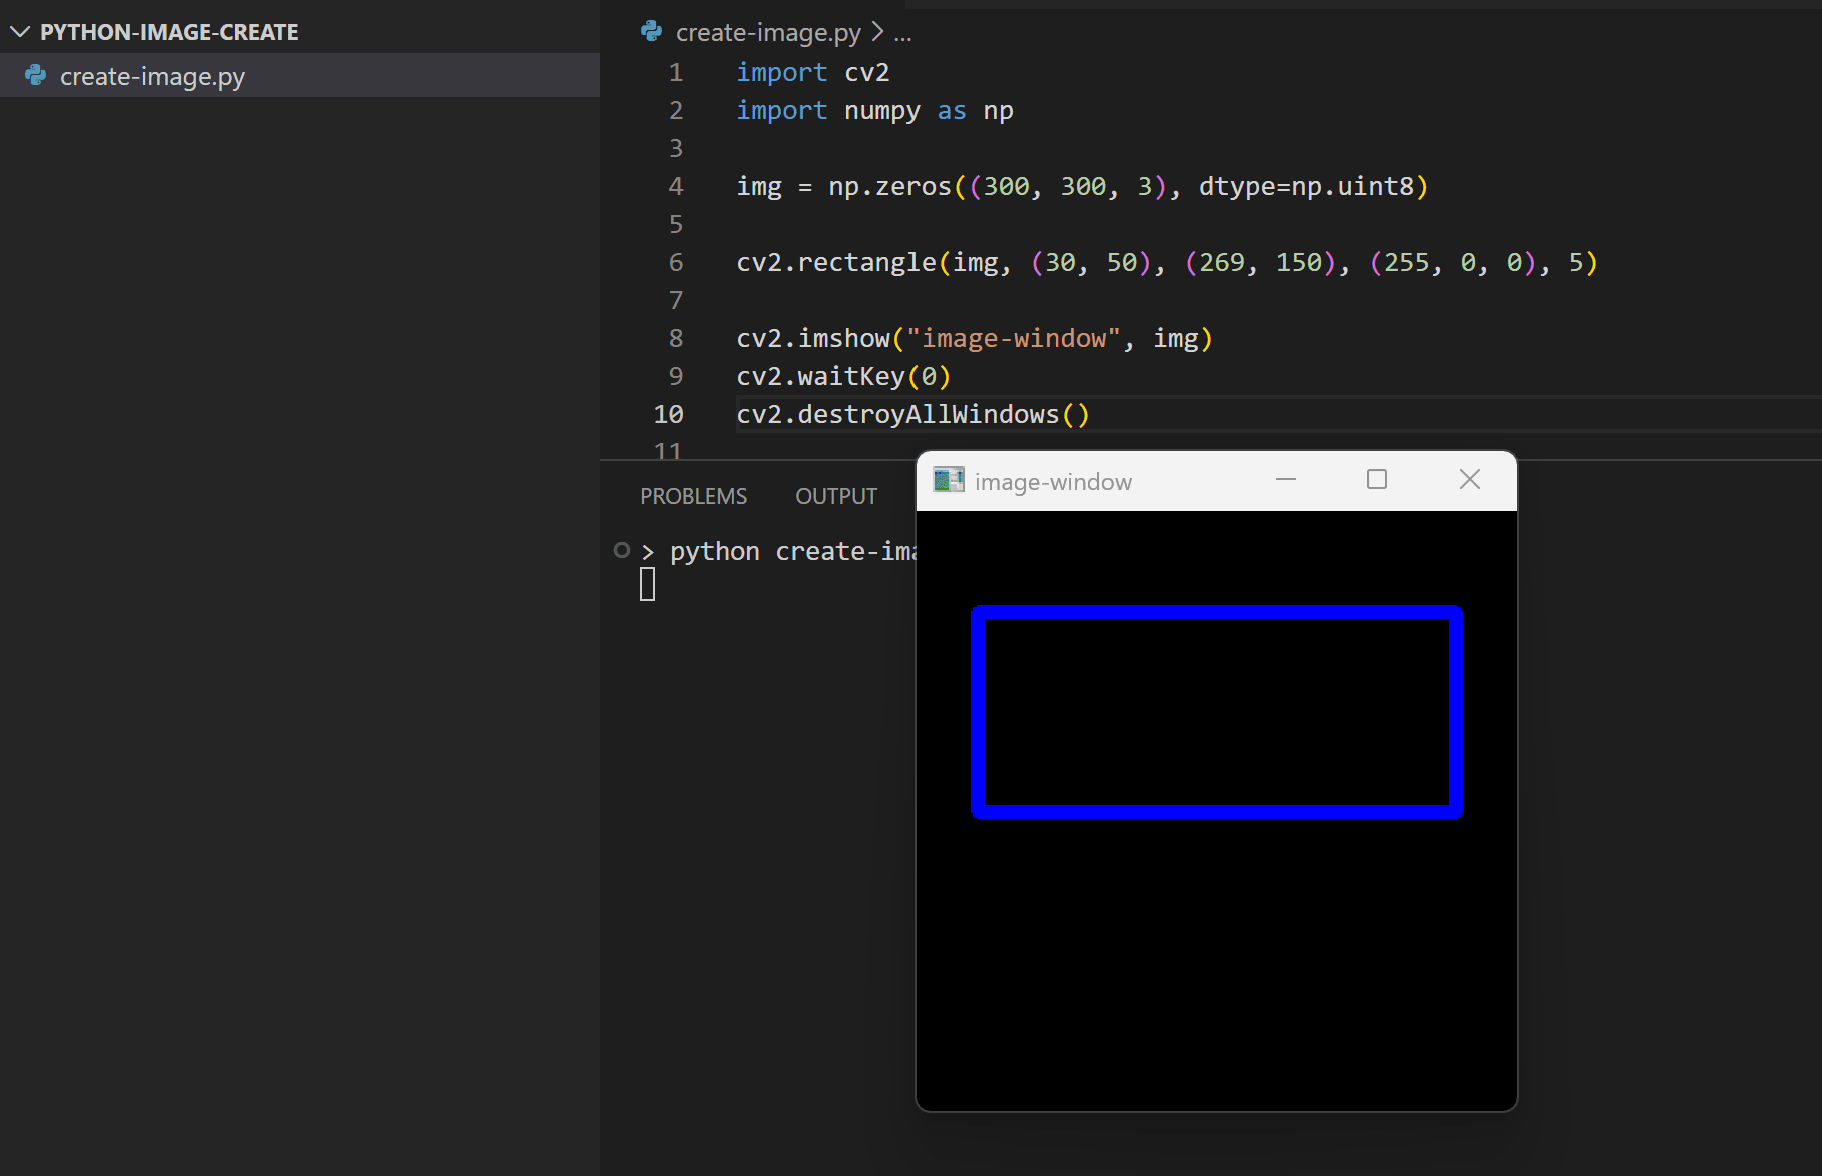
Next, let’s draw a rectangle shape. This time we’ll use cv2.rectangle() method as follows:
import cv2
import numpy as np

img = np.zeros((300, 300, 3), dtype=np.uint8)

cv2.rectangle(img, (30, 50), (269, 150), (255, 0, 0), 5)

cv2.imshow("image-window", img)
cv2.waitKey(0)
cv2.destroyAllWindows()
The cv2.rectangle() method takes the same parameters as the previous cv2.line() method, with the starting point referring to the top-left corner of the rectangle, and the ending point referring to the bottom-right corner:
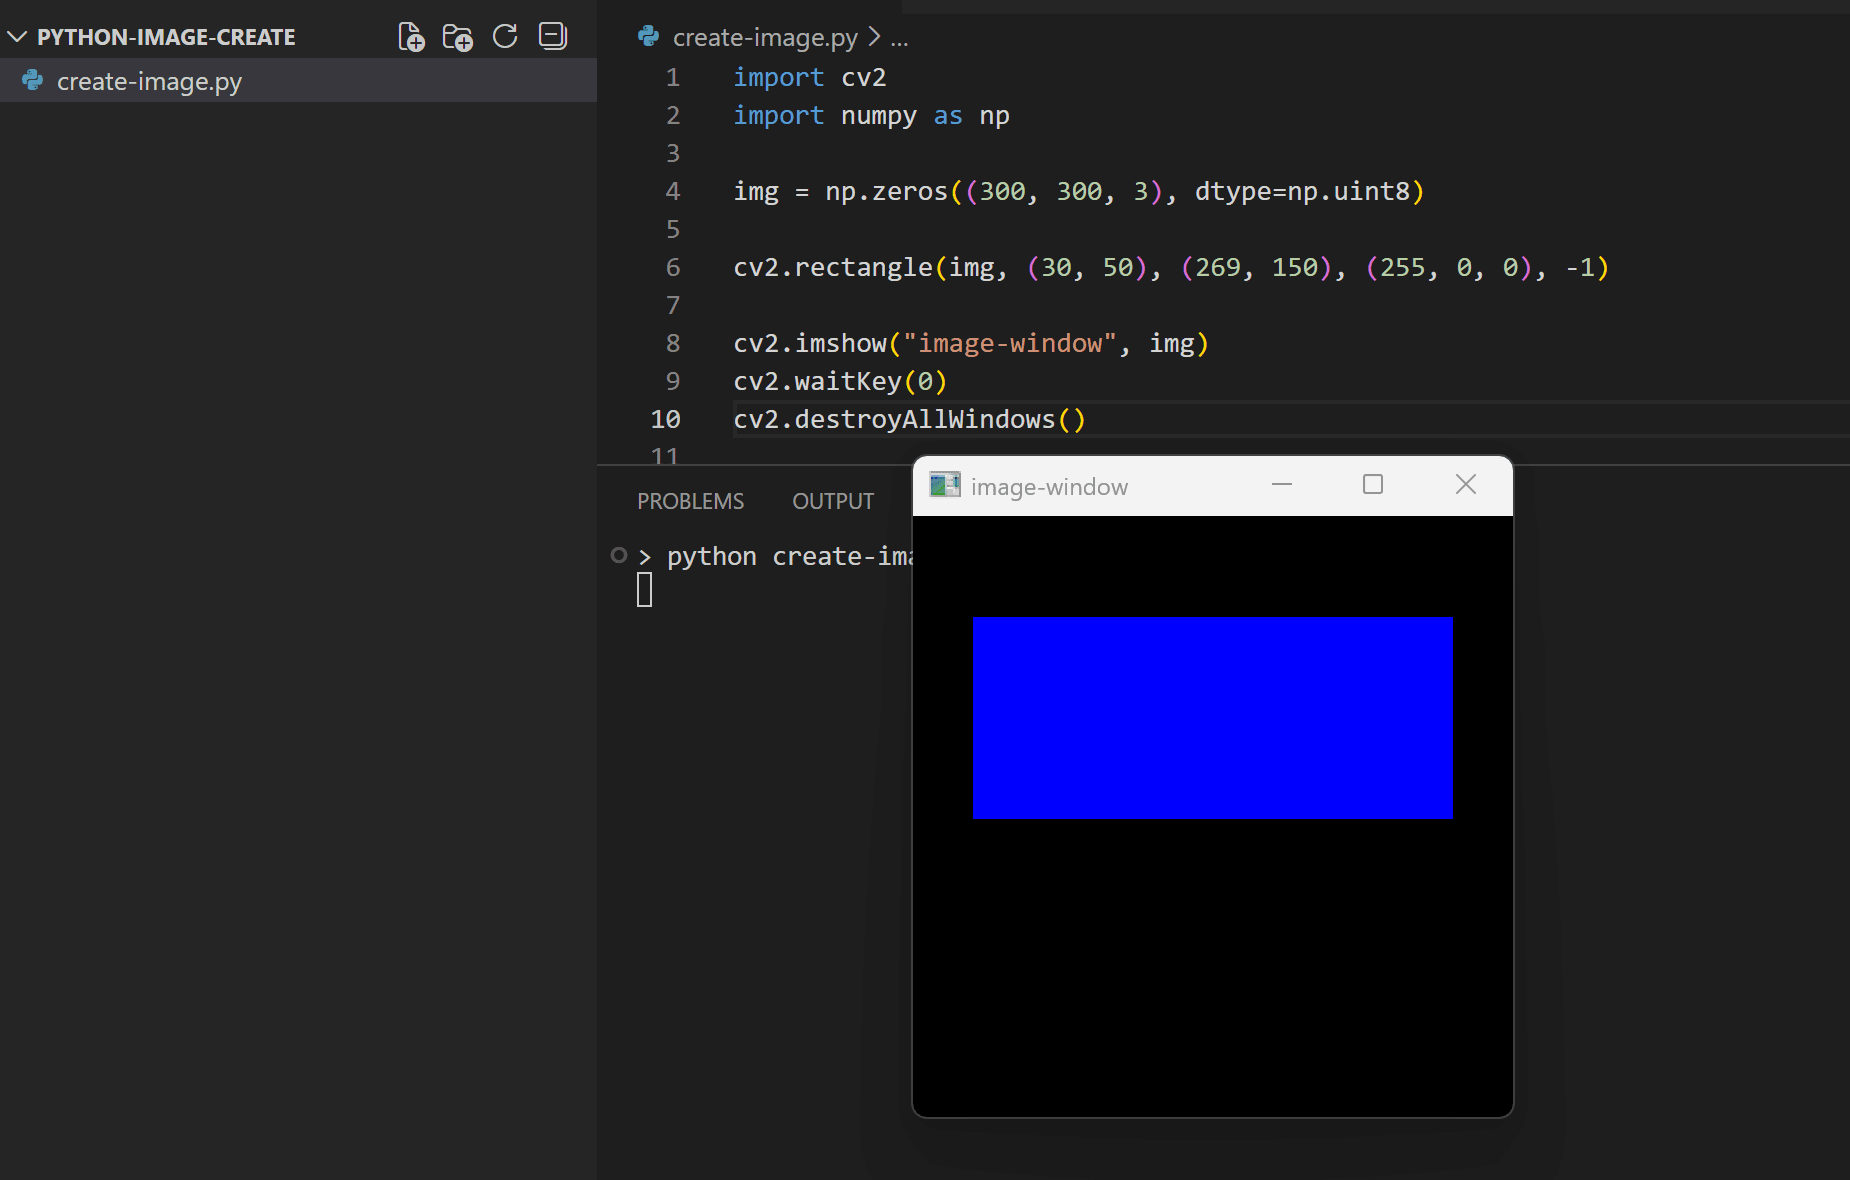
Also if you set the thickness value to -1 it will fill the shape with the provided color:
import cv2
import numpy as np

img = np.zeros((300, 300, 3), dtype=np.uint8)

cv2.rectangle(img, (30, 50), (269, 150), (255, 0, 0), -1)

cv2.imshow("image-window", img)
cv2.waitKey(0)
cv2.destroyAllWindows()
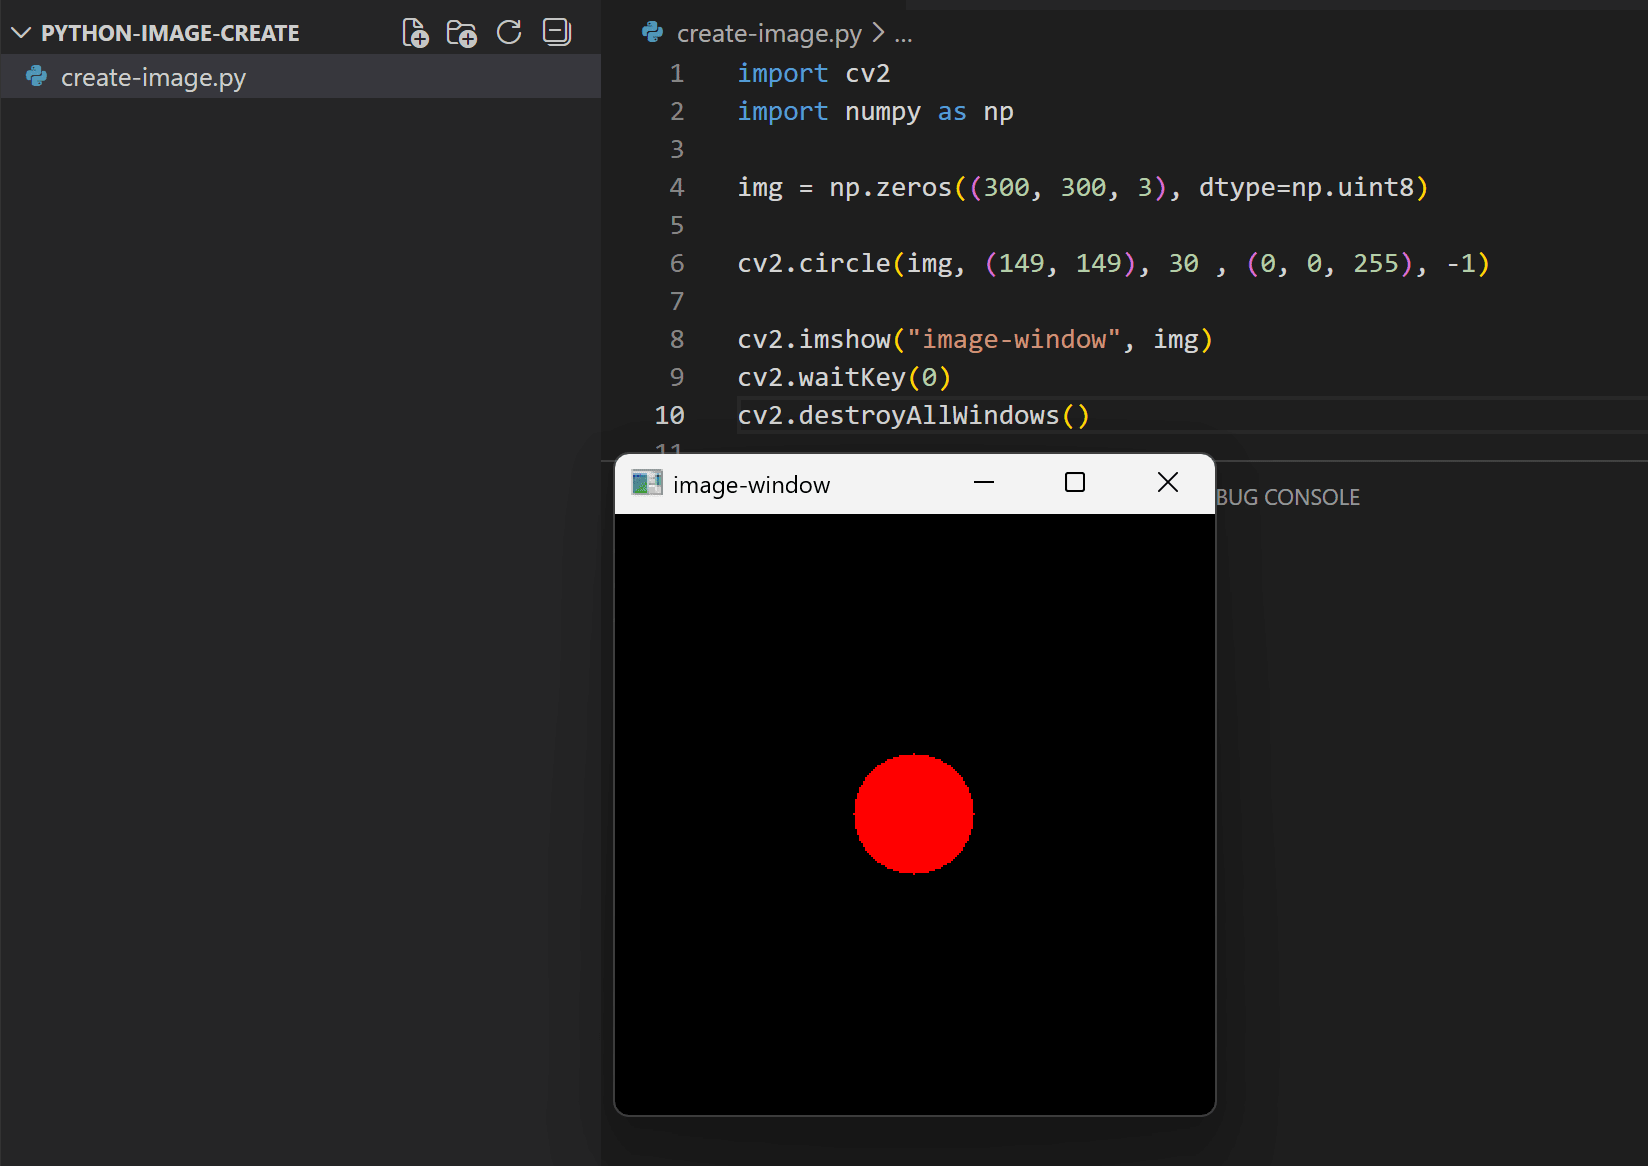
OpenCV also has a method for drawing circle shapes through cv2.circle(). It takes the same parameters as the previous shapes’ methods, with the starting coordinate representing the circle center, and the ending coordinate replaced by an integer that represents the circle radius:
import cv2
import numpy as np

img = np.zeros((300, 300, 3), dtype=np.uint8)

cv2.circle(img, (149, 149), 30 , (0, 0, 255), -1)

cv2.imshow("image-window", img)
cv2.waitKey(0)
cv2.destroyAllWindows()
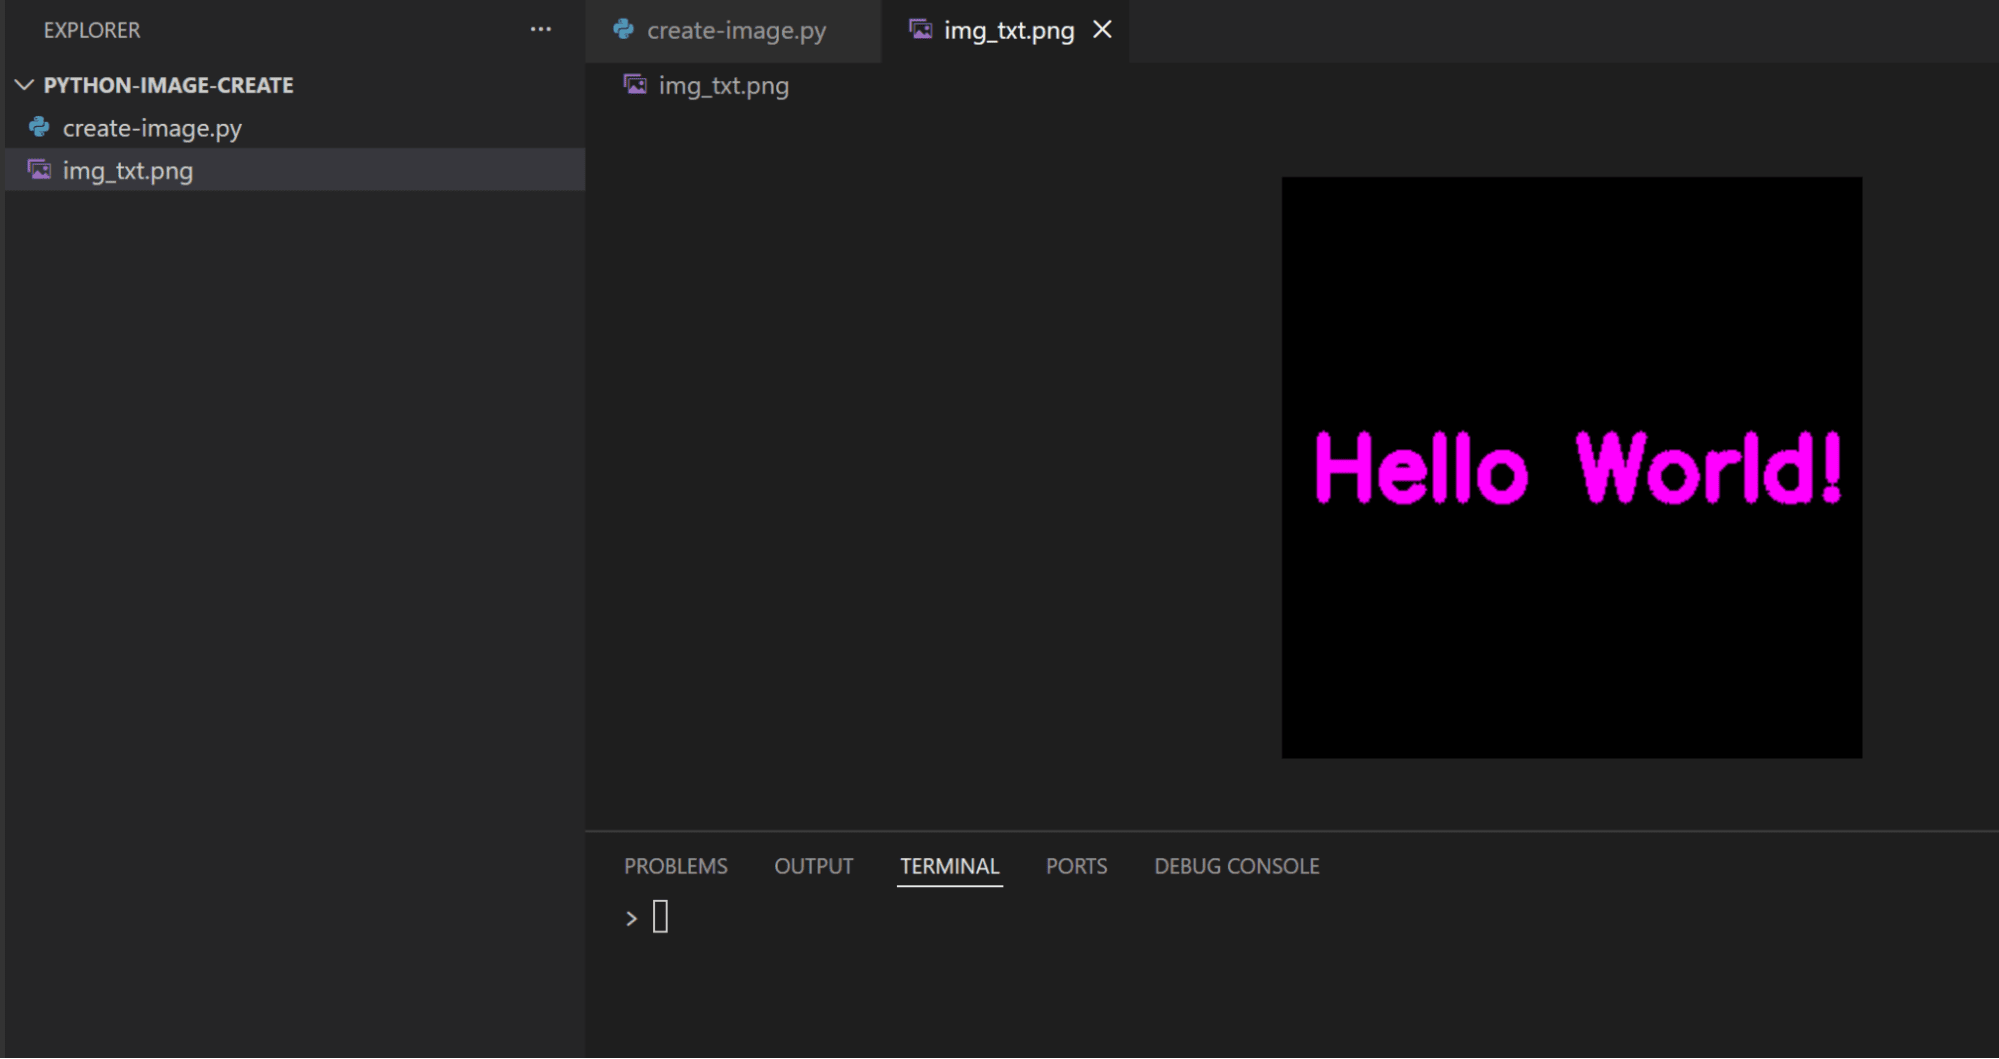
Add Text
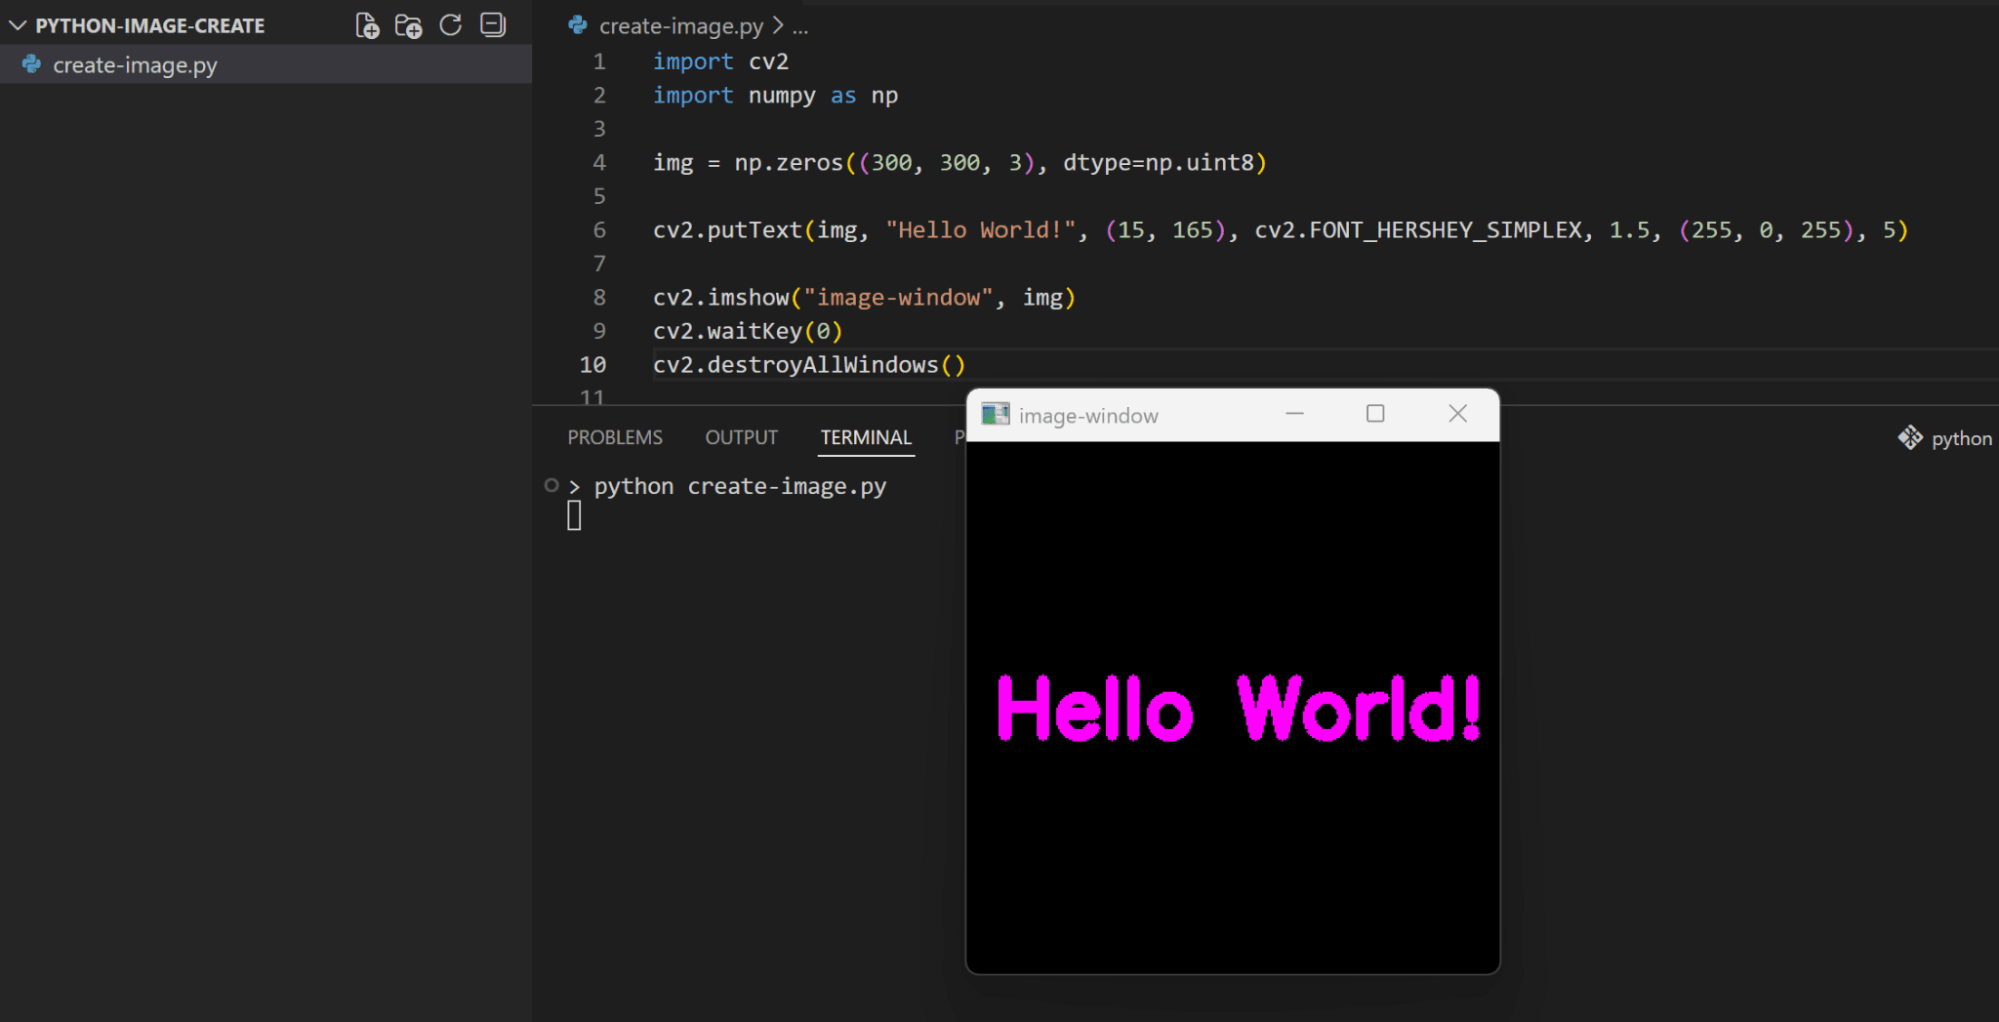
OpenCV also makes it easy to draw text on the screen. It provides a method for doing this called cv2.putText(). We create an image as a background then we use this method to draw text on this image space as follows:
import cv2
import numpy as np

img = np.zeros((300, 300, 3), dtype=np.uint8)

cv2.putText(img, "Hello World!", (15, 165), cv2.FONT_HERSHEY_SIMPLEX, 1.5, (255, 0, 255), 5)

cv2.imshow("image-window", img)
cv2.waitKey(0)
cv2.destroyAllWindows()
The parameters that cv2.putText() method takes are:
- Image name
- Text to draw
- Coordinates of the
org(which represents the bottom-left point of a rectangle that holds the text) - Font type (which OpenCV provides some basic built-in options)
- Font scale
- Font color
- Thickness
Apply Gradients
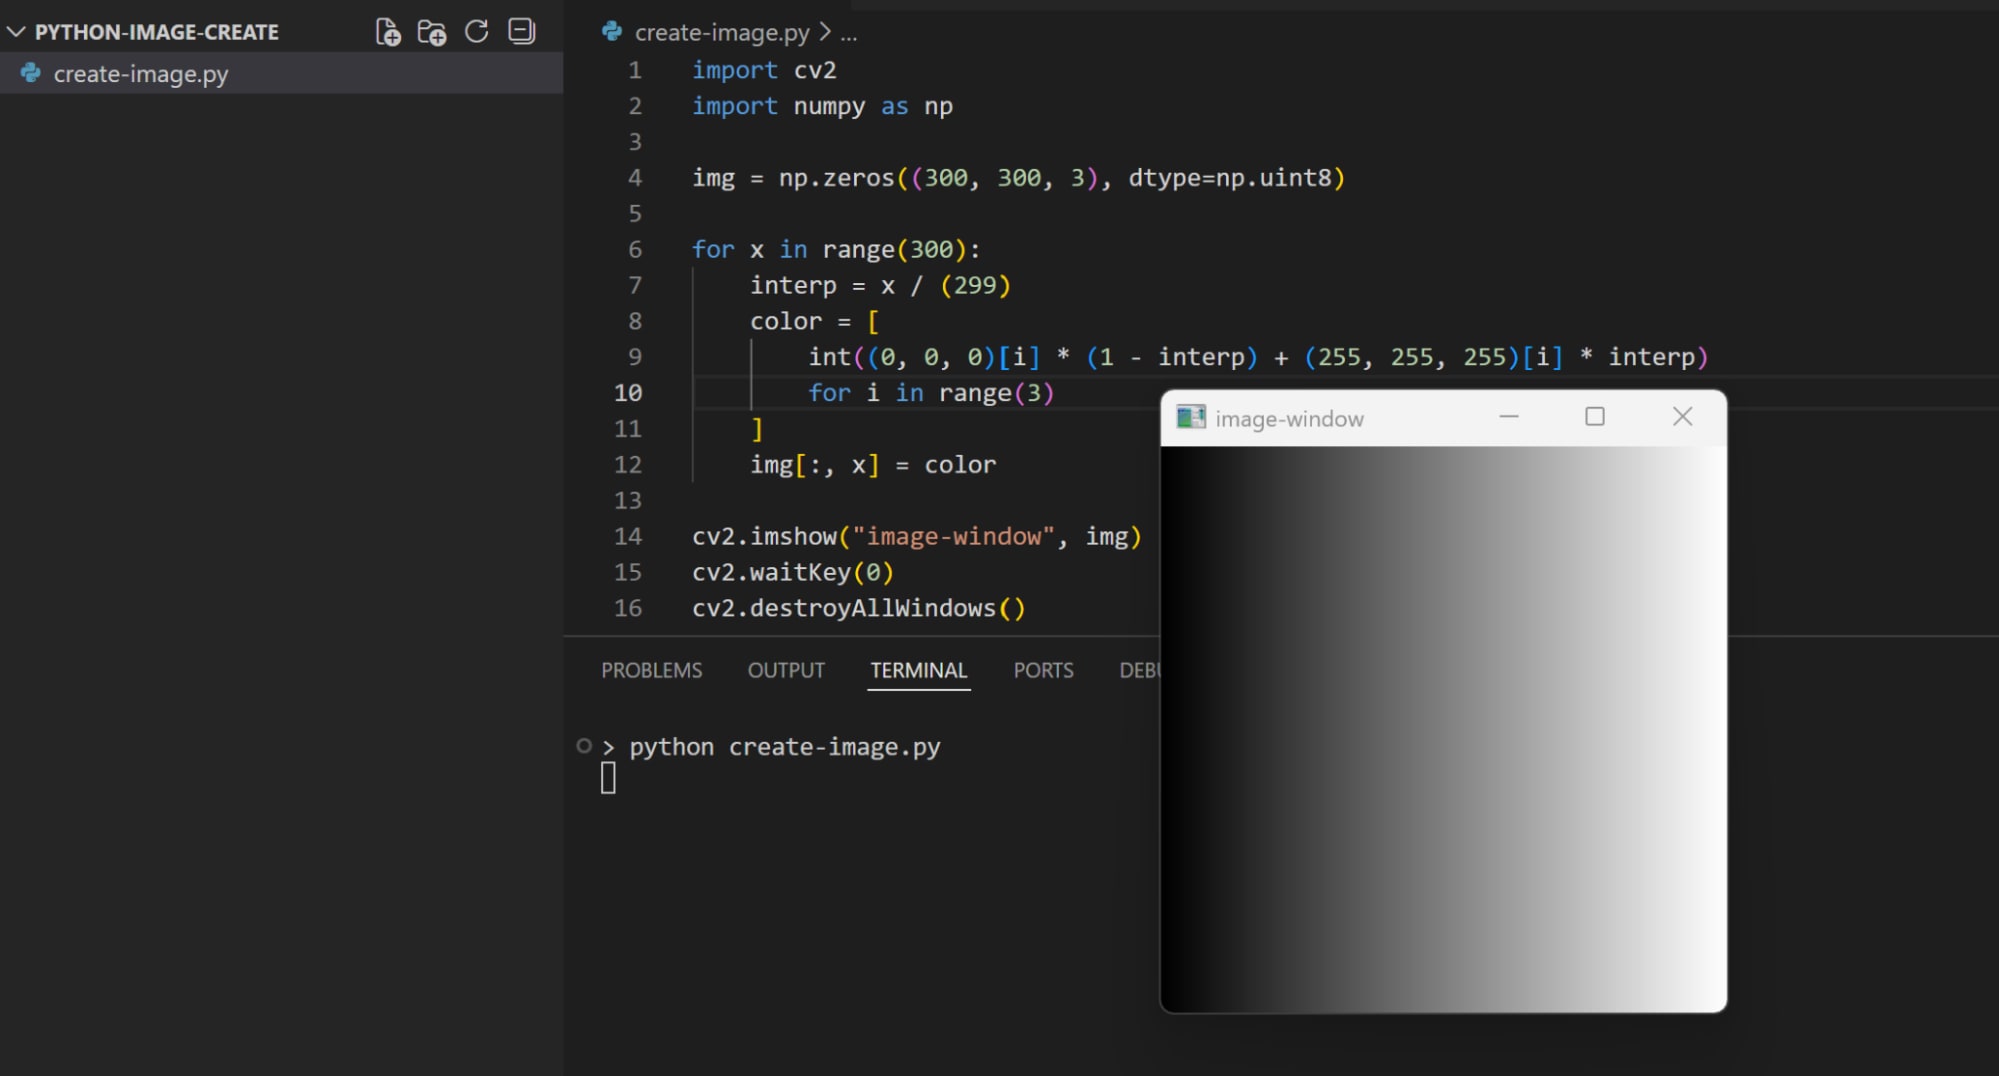
OpenCV doesn’t provide a built-in method for applying gradients. But we can manually implement it by changing the pixel color intensity and control the gradient direction using the following code:
import cv2
import numpy as np

img = np.zeros((300, 500, 3), dtype=np.uint8)

for x in range(300):
    interp = x / (299)
    color = [
        int((0, 0, 0)[i] * (1 - interp) + (255, 255, 255)[i] * interp)
        for i in range(3)
    ]
    img[:, x] = color

cv2.imshow("image-window", img)
cv2.waitKey(0)
cv2.destroyAllWindows()
Here we’re making the gradient direction to horizontal as we’re applying the new pixel value while moving through the columns (img[:, x] = color), and we’re specifying the gradient colors to start from black (0, 0, 0) to white (255, 255, 255):
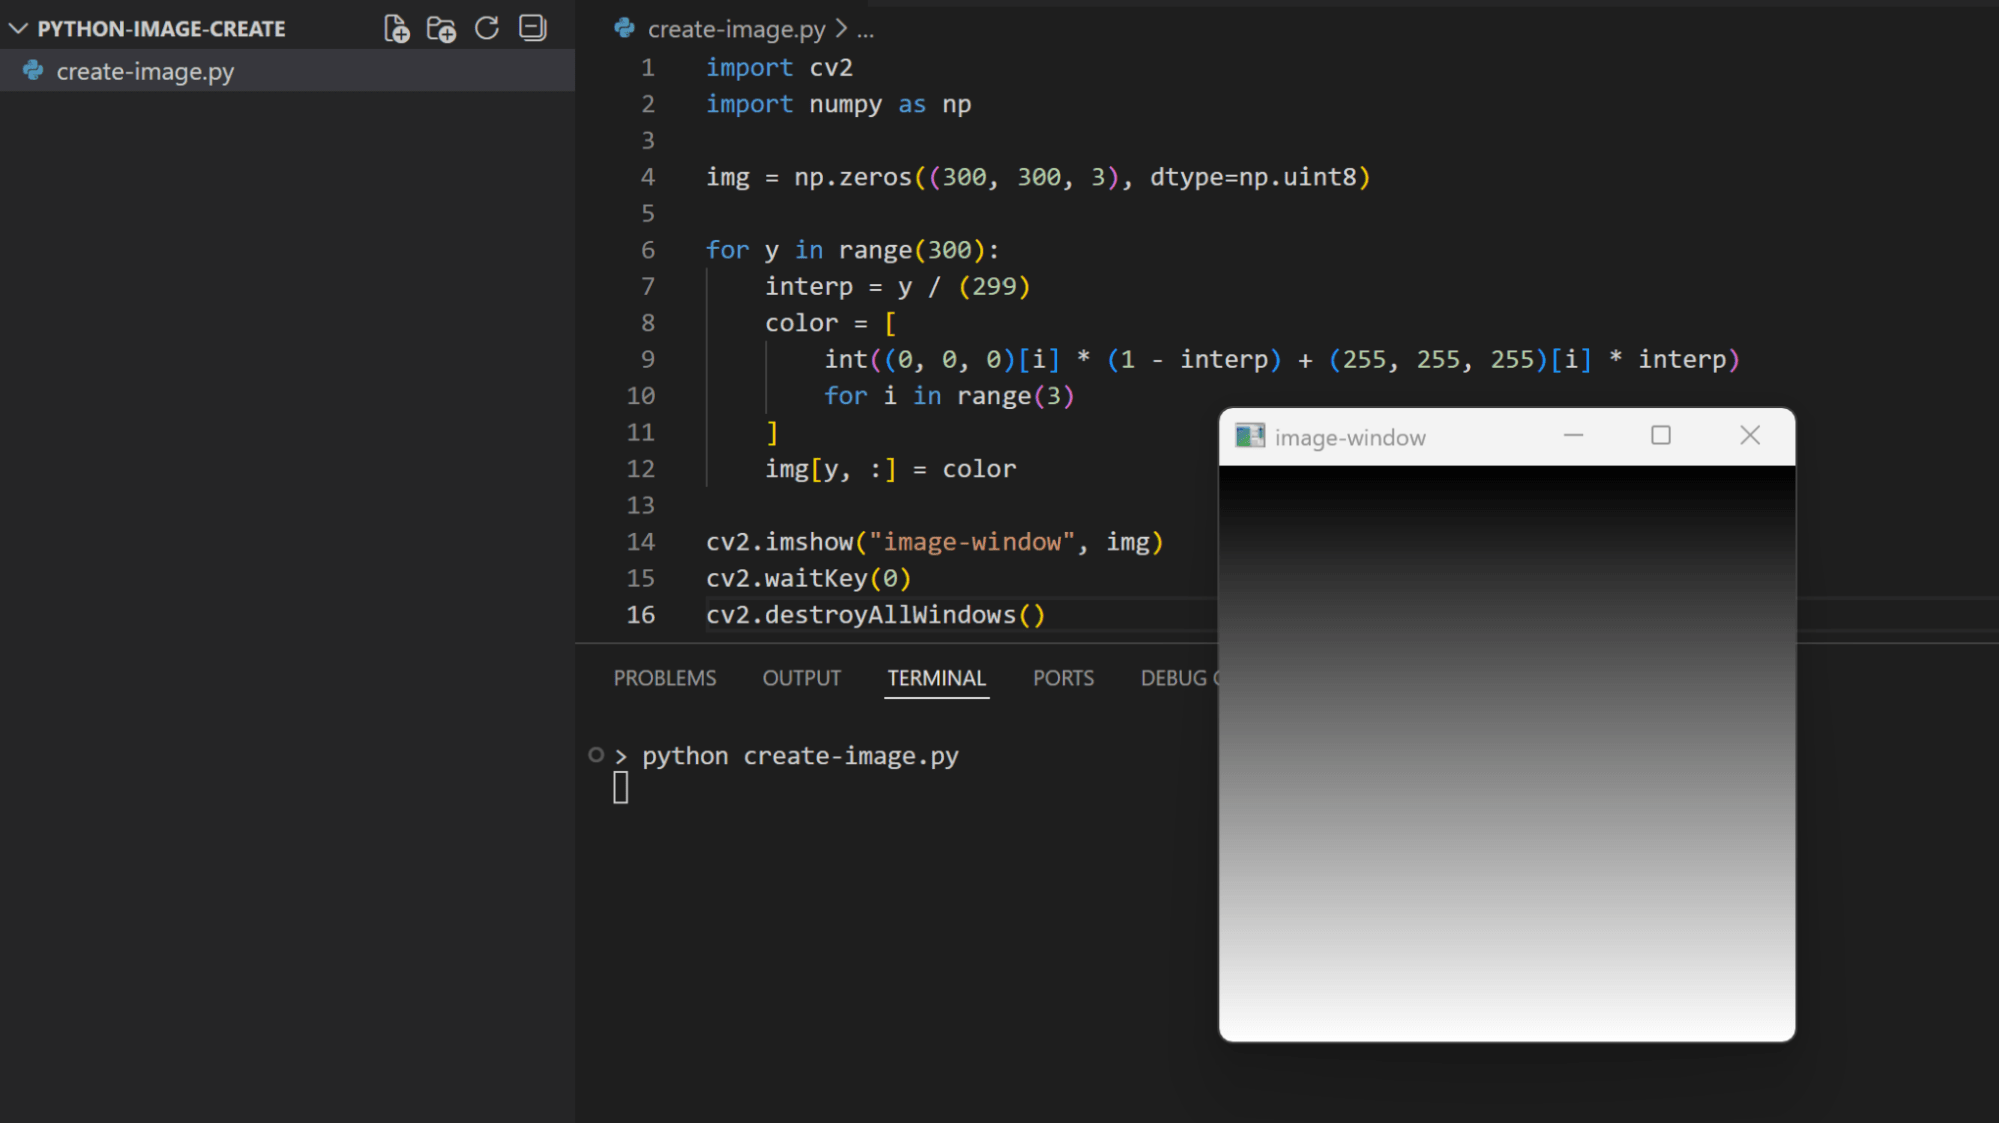
We can change the gradient direction by moving through the rows instead of columns:
import cv2
import numpy as np

img = np.zeros((300, 300, 3), dtype=np.uint8)

for y in range(300):
    interp = y / (299)
    color = [
        int((0, 0, 0)[i] * (1 - interp) + (255, 255, 255)[i] * interp)
        for i in range(3)
    ]
    img[y, :] = color

cv2.imshow("image-window", img)
cv2.waitKey(0)
cv2.destroyAllWindows()
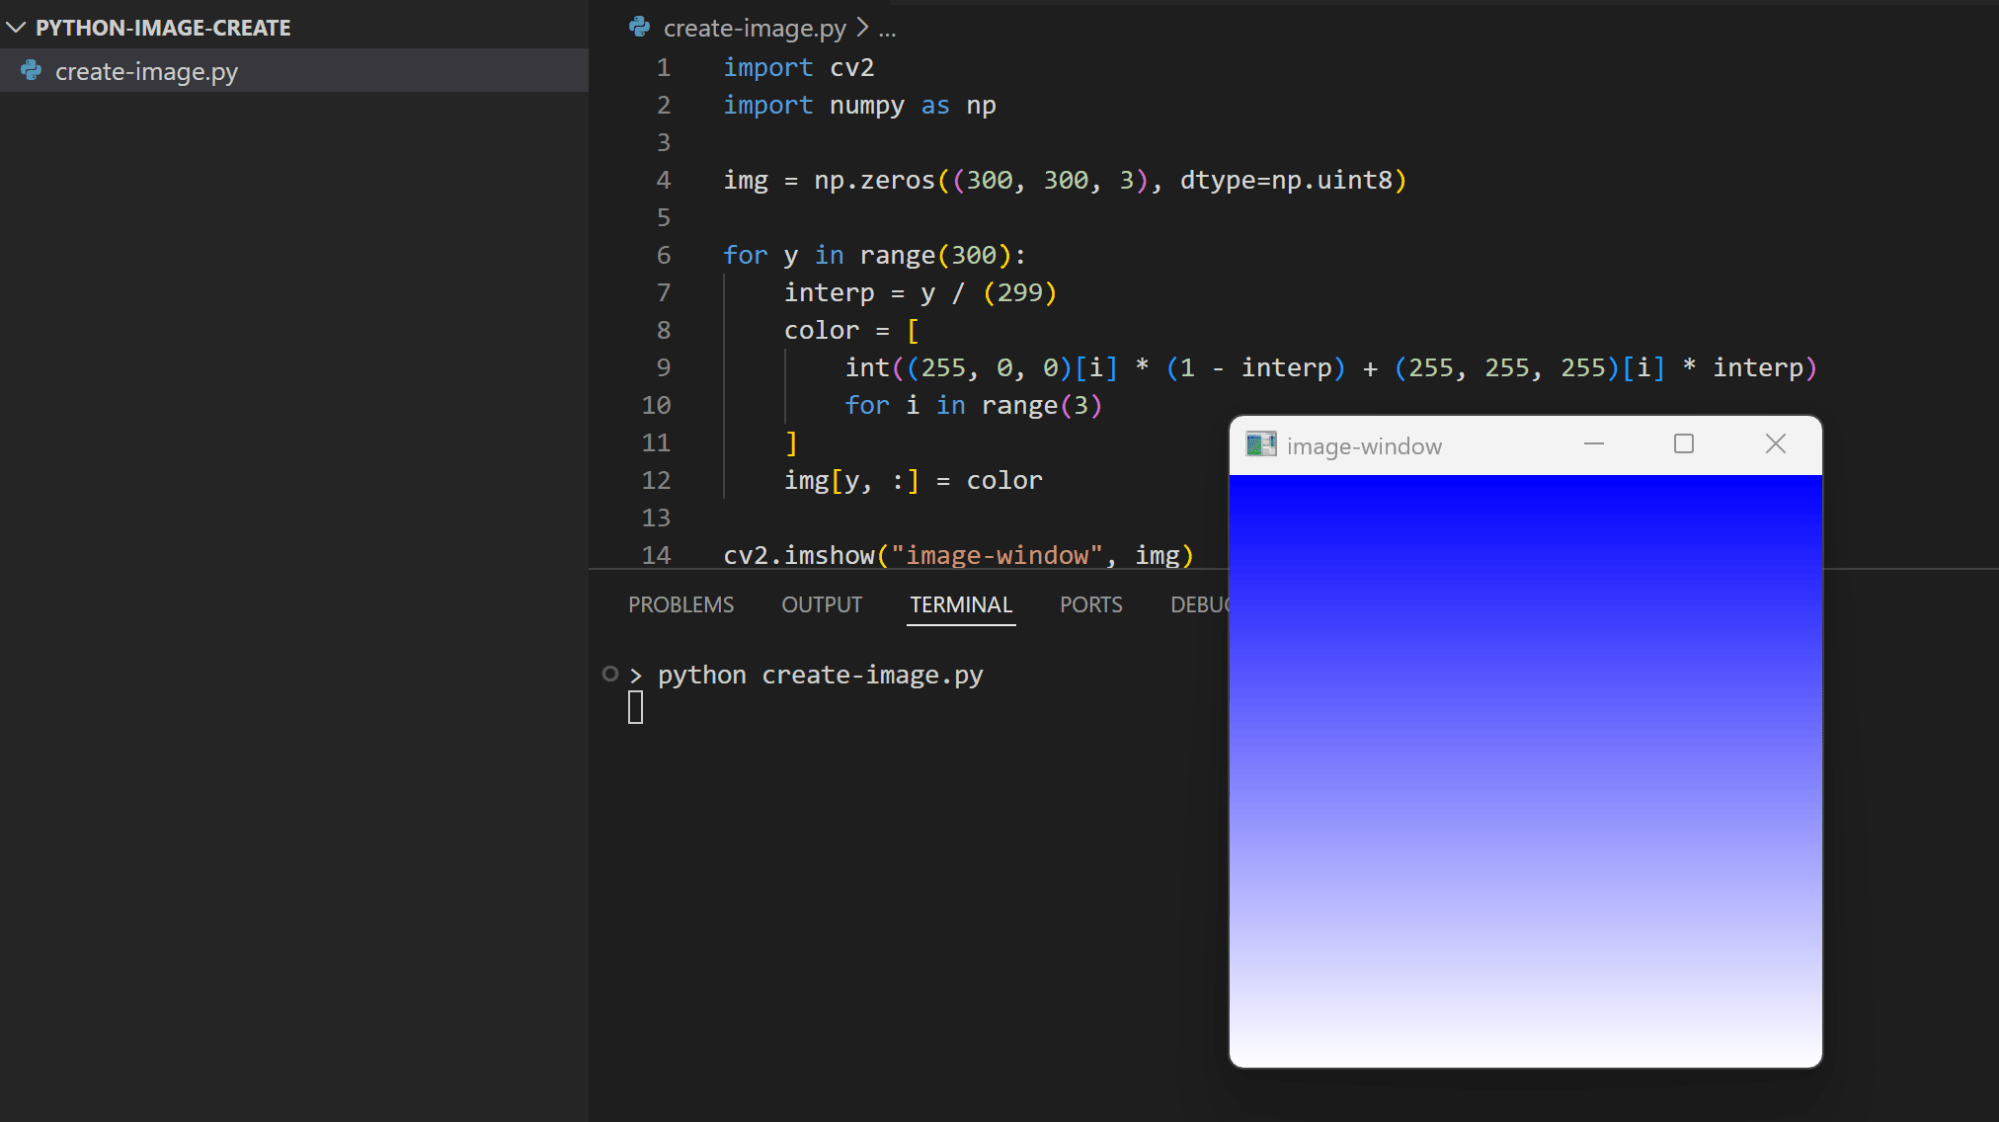
Or we can change the color gradient by changing the starting color:
import cv2
import numpy as np

img = np.zeros((300, 300, 3), dtype=np.uint8)

for y in range(300):
    interp = y / (299)
    color = [
        int((255, 0, 0)[i] * (1 - interp) + (255, 255, 255)[i] * interp)
        for i in range(3)
    ]
    img[y, :] = color

cv2.imshow("image-window", img)
cv2.waitKey(0)
cv2.destroyAllWindows()
Saving and Compressing Images: PNG, JPEG, and WebP
After creating an image and manipulating it as needed, we can save it as a file with a specific format and compression/quality level. OpenCV also provides a method called cv2.imwrite() that enables us to easily do this.
For example, let’s save the image where we added a text to a file with PNG format:
import cv2
import numpy as np

img = np.zeros((300, 300, 3), dtype=np.uint8)

cv2.putText(img, "Hello World!", (15, 165), cv2.FONT_HERSHEY_SIMPLEX, 1.5, (255, 0, 255), 5)

cv2.imwrite("img_txt.png", img)
The cv2.imwrite() takes as a parameter the file name that you want to store your image with, and the NumPy array of the image. The file name extension is used to determine the image format to use, so a .png extension tells OpenCV to save the image in PNG format.
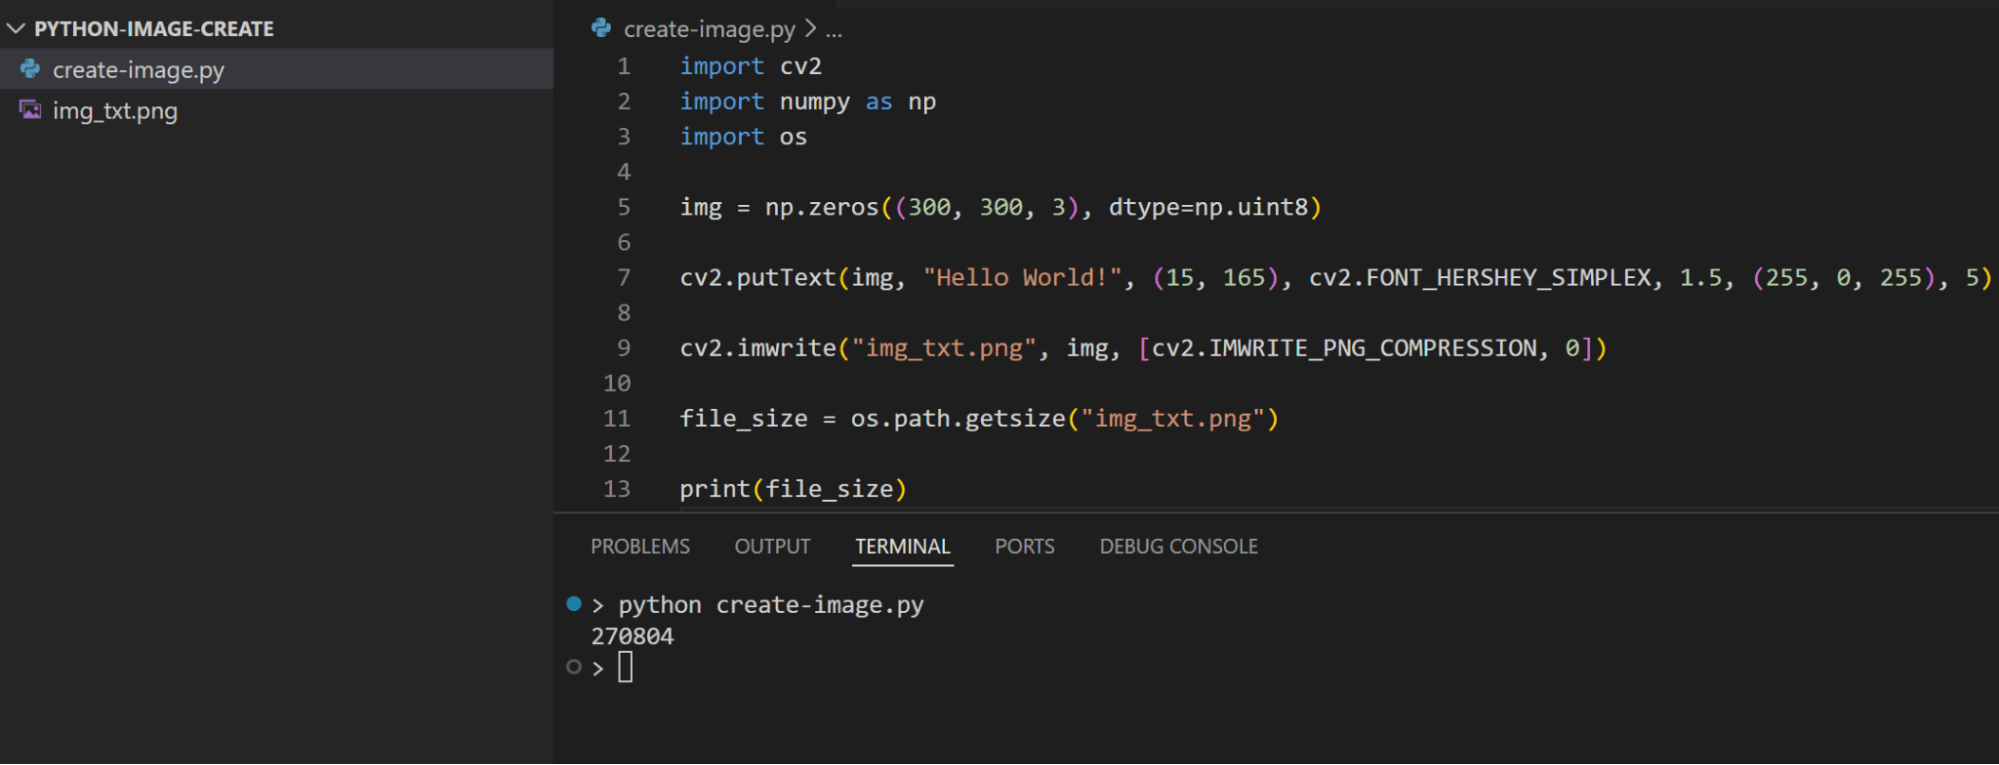
The cv2.imwrite() has a third optional parameter which we can use to provide flags that specify properties for saving the image like compression level or quality. For example, we can set the compression level for the previous PNG image as follows:
import cv2
import numpy as np

img = np.zeros((300, 300, 3), dtype=np.uint8)

cv2.putText(img, "Hello World!", (15, 165), cv2.FONT_HERSHEY_SIMPLEX, 1.5, (255, 0, 255), 5)

cv2.imwrite("img_txt.png", img, [cv2.IMWRITE_PNG_COMPRESSION, 0])
Here, we used the compression level of 0 which means no image compression algorithms are used. This takes the shortest time to save the image file, but with the largest file size.
We can check the file size of the saved image as follows:
import cv2
import numpy as np
import os

img = np.zeros((300, 300, 3), dtype=np.uint8)

cv2.putText(img, "Hello World!", (15, 165), cv2.FONT_HERSHEY_SIMPLEX, 1.5, (255, 0, 255), 5)

cv2.imwrite("img_txt.png", img, [cv2.IMWRITE_PNG_COMPRESSION, 0])

file_size = os.path.getsize("img_txt.png")

print(file_size)
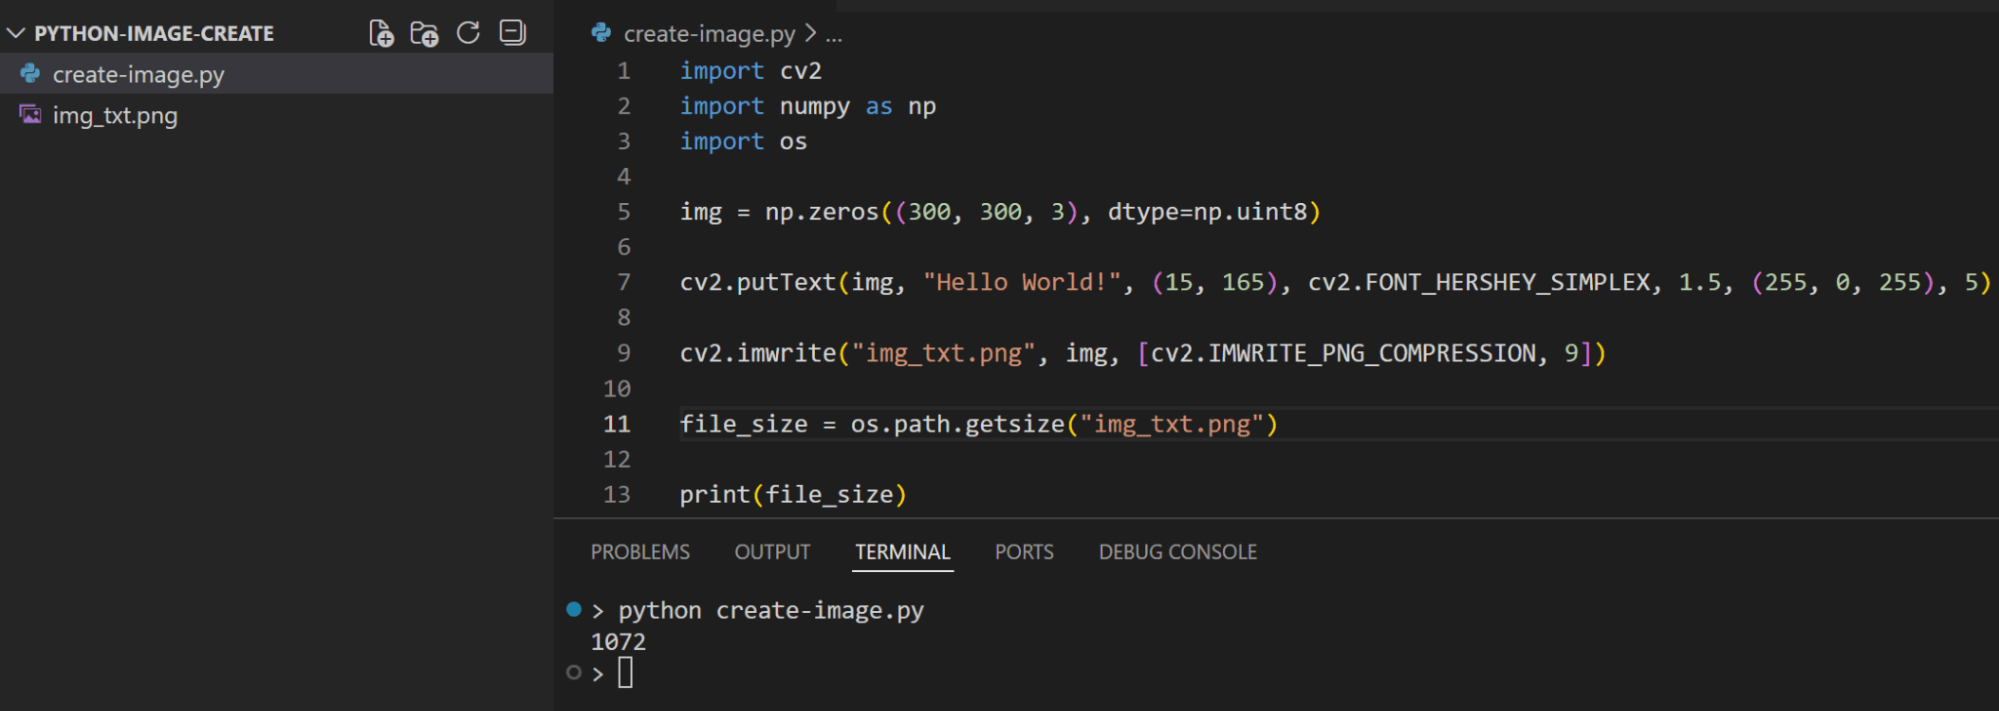
Now if we change the compression level to the highest value of 9, we should see the difference in image file size:
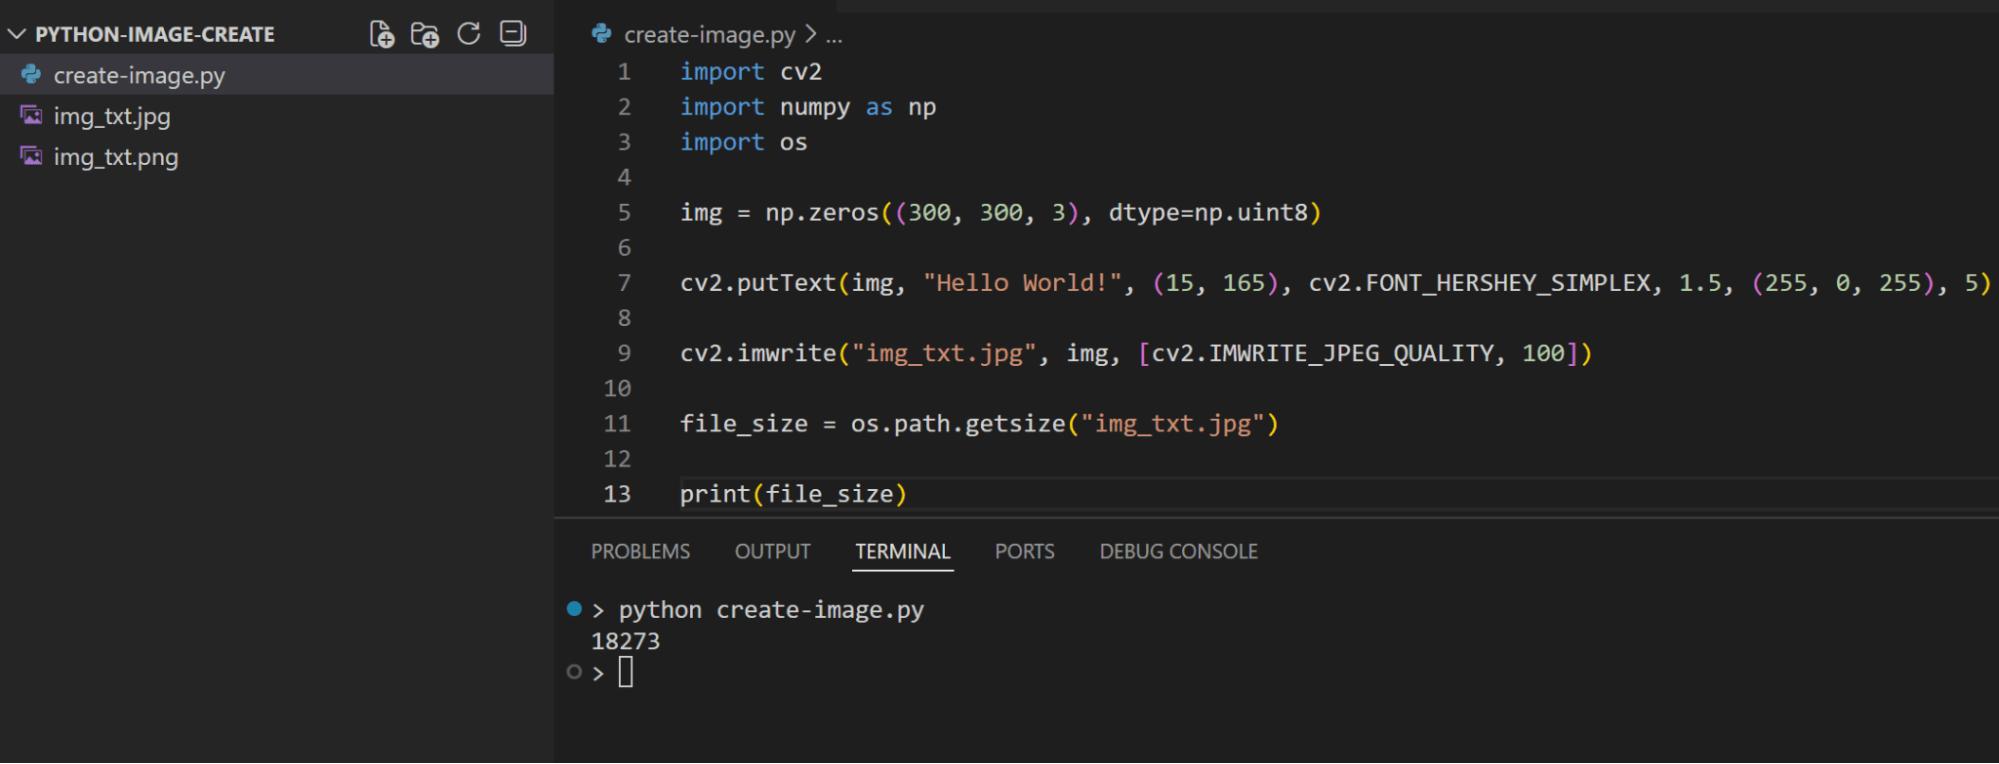
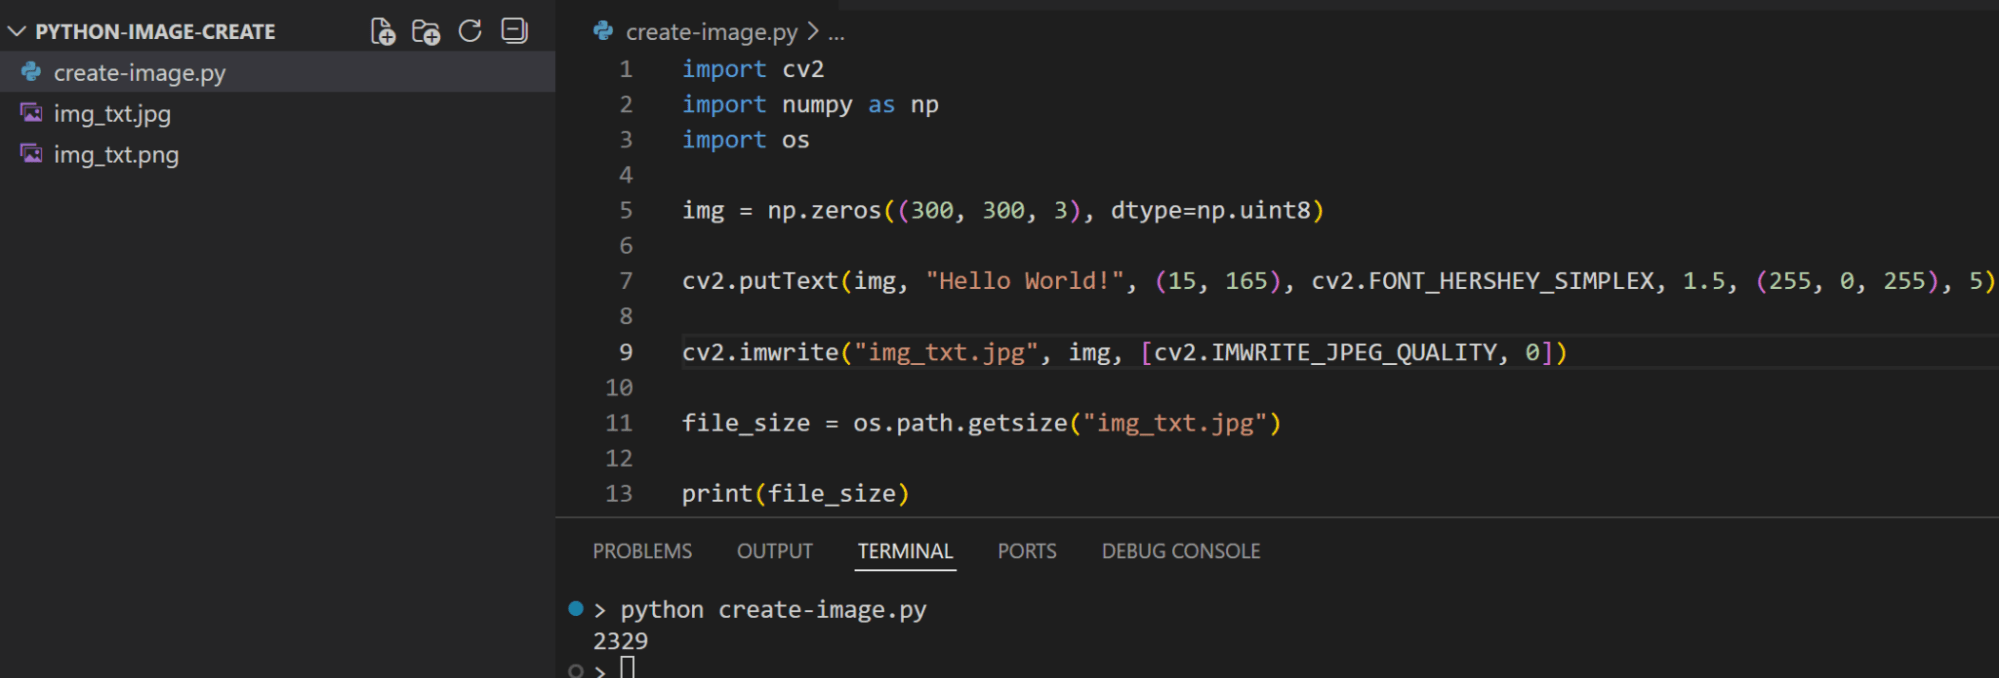
Similarly, we can save the image in a JPEG format by changing the extension to .jpg. The compression level of JPEG format is specified by setting an image quality value between 0-100, with 0 being the lowest quality/highest compression, and 100 is the highest quality/lowest compression:
import cv2
import numpy as np
import os

img = np.zeros((300, 300, 3), dtype=np.uint8)

cv2.putText(img, "Hello World!", (15, 165), cv2.FONT_HERSHEY_SIMPLEX, 1.5, (255, 0, 255), 5)

cv2.imwrite("img_txt.jpg", img, [cv2.IMWRITE_JPEG_QUALITY, 100])

file_size = os.path.getsize("img_txt.jpg")

print(file_size)
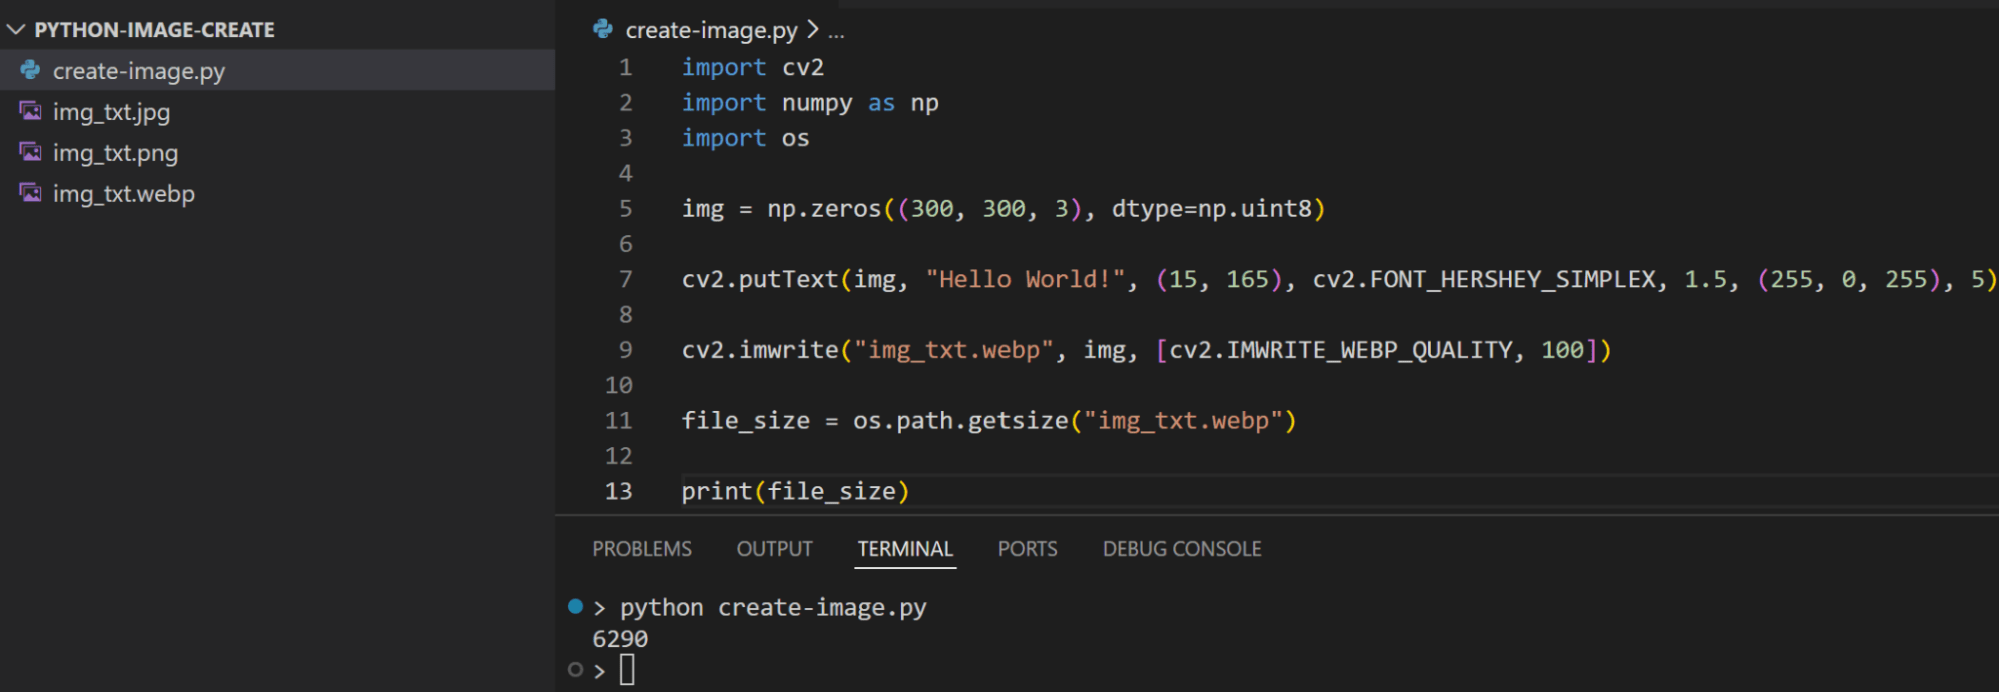
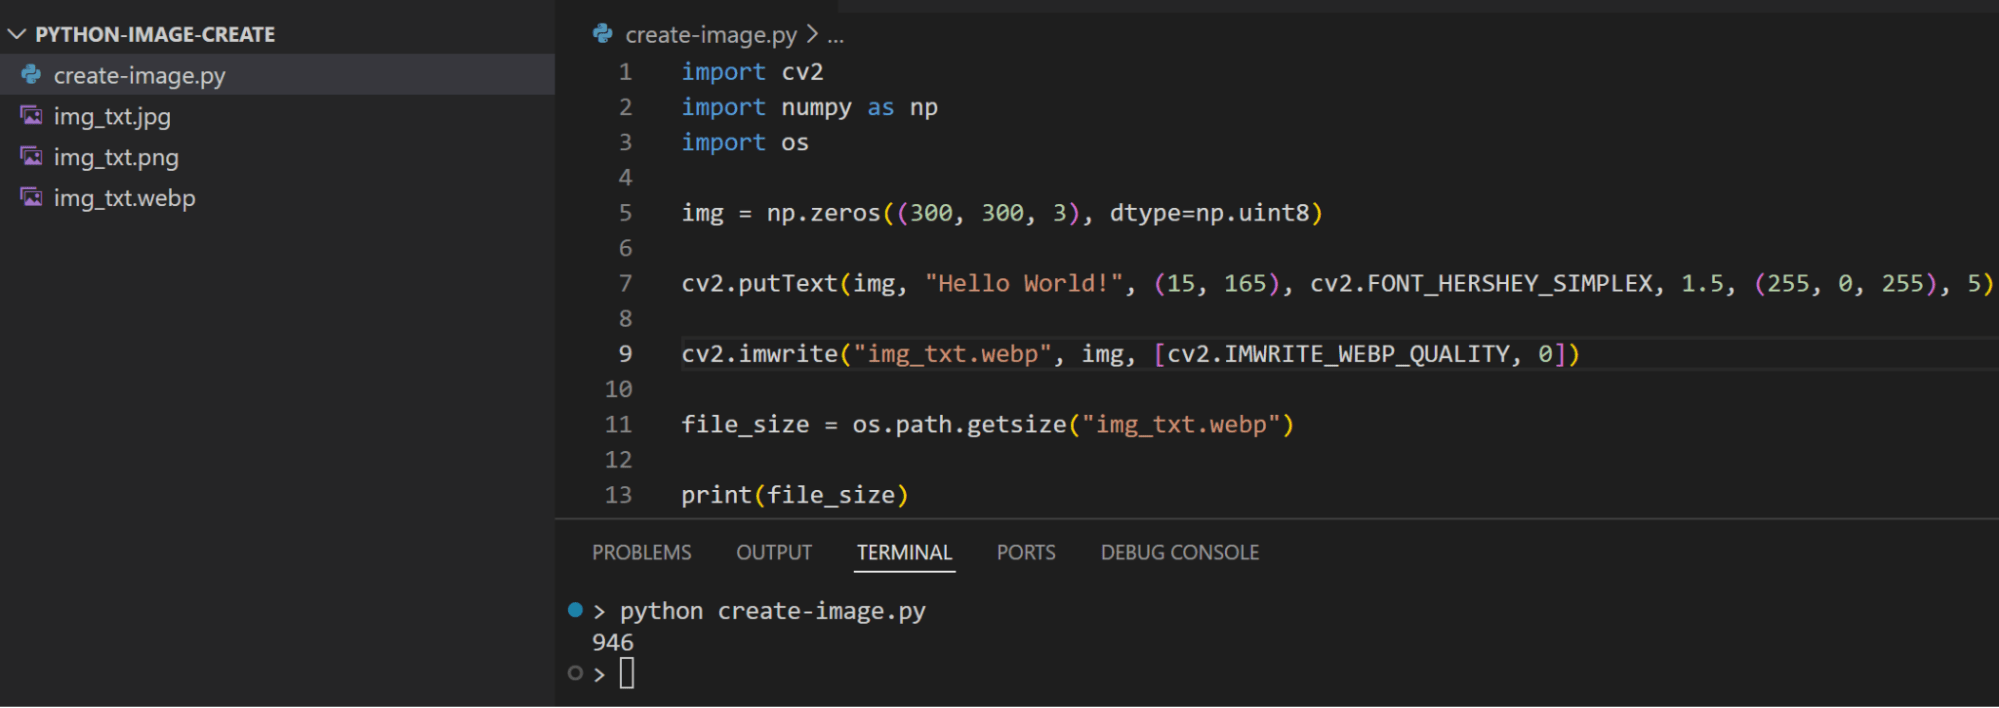
Another format that’s supported when saving the image is the WebP format. It also uses a quality parameter like the JPEG format for specifying the compression/quality level:
import cv2
import numpy as np
import os

img = np.zeros((300, 300, 3), dtype=np.uint8)

cv2.putText(img, "Hello World!", (15, 165), cv2.FONT_HERSHEY_SIMPLEX, 1.5, (255, 0, 255), 5)

cv2.imwrite("img_txt.webp", img, [cv2.IMWRITE_WEBP_QUALITY, 100])

file_size = os.path.getsize("img_txt.webp")

print(file_size)
Frequently Asked Questions
How to create an image in Python?
Python includes different libraries for image processing that help create images programmatically. To create an image, you initialize the data structure (like a NumPy array) with the image data with pixel values, then you use these libraries to read this data.
What Python library generates images?
OpenCV, Pillow, and Matplotlib are the most common Python libraries for creating/generating images.
What is a Python image library?
Python image libraries facilitate the process of creating, manipulating, storing, and displaying images. They abstract the complex low-level details and provide easy-to-use functions and objects to work with images.

