Media Inspector browser extension
Last updated: Dec-28-2025
The Cloudinary Media Inspector is a browser extension that analyzes all media assets on your site and shows you in-depth information about each asset, including file size, status, Cloudinary transformations, and more. Use the Media Inspector to debug your Cloudinary media on your website or application and to help you enhance the performance and appearance of your media assets.
Installation
- Add the extension from the Chrome Web Store.
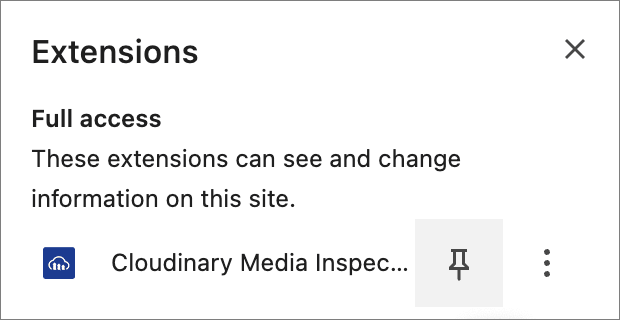
- Pin the Media Inspector icon to your browser extension toolbar.
Pin the Media Inspector to the toolbar
- Right-click the icon in the extension toolbar and select Options to set your preferences. You can set the theme, unit of measurement, and keyboard shortcuts:
Set Cloudinary Media Inspector options
You can launch the Media Inspector for all media on a page or for a single media file.
Inspect all media on a page
To see a list of all media assets on the page and information about each asset:
- Click the Cloudinary Media Inspector button in the extensions section of Chrome, located in the top right corner (if you pinned it to the toolbar). The icon for the Media Inspector is the blue Cloudinary logo.
- The Media Overview page opens, showing all media on the page. From here, you can filter results based on search expressions and drill down into specific files.
 Media Inspector: view all media
Media served from Cloudinary shows Cloudinary as the Service, so you can clearly see which of your media assets aren't stored in Cloudinary.
At the bottom of the screen, you can view stats for the minimum, maximum, average, and total delivered bytes for the assets presented. The 1xx, 2xx, etc. refer to HTTP status codes. You can also see the number of bytes saved due to applied optimizations.
To see details of a specific asset, click View in the Details column. This opens the same details as described in Inspect a single media file.
Filter results
Enter search expressions in the fields at the top of the columns to filter the media on the page.
For example, to see which images aren't delivered with automatic format and quality optimizations, enter !f_auto AND !q_auto in the URL search field and Image in the Content Type field:
Or, to see which assets are over 500 KB, enter >500000 in the Size field.
The information at the bottom of the screen updates based on your filtered results. For example, in the above screen capture, 10 assets are over 500 KB, and they're all videos.
Sort results
Sort the results by clicking a column name. For example, to order the results by size, click the Size heading.
Inspect elements
To inspect the elements in the page that deliver a specific asset, click the number in the Number of elements (#) column for that asset:
Looking at the elements, you can see, for example, any sizing (width/height) attributes that are being applied in addition to any Cloudinary resize transformations in the URL.
Understand scaling
The Scale Ratio field indicates whether your images and videos are being upscaled, downscaled, or displayed with modified aspect ratios.
scale ratio = served resolution / display resolution
A scale ratio of 1.00 means the image or video is served at exactly the right resolution for the display, either because it's stored at the correct resolution, or because it's served with Cloudinary resize transformations applied.
A scale ratio less than 1.00 means the image or video is being upscaled, which may cause quality issues. Consider replacing the stored asset with a higher resolution asset, or, if that's not possible, apply an enhancement transformation, such as the automatic enhancement effect for images.
A scale ratio greater than 1.00 means the image or video is being downscaled. The served asset is larger than required, so delivering this asset uses more bandwidth than required. Consider resizing these assets in the delivery URL so that they're served at the display size.
Mismatched width and height scaling
Hovering over the Scale Ratio shows you the Width Ratio and Height Ratio separately, where:
width ratio = served width / display widthheight ratio = served height / display height
If the width and height ratios are different, the displayed image or video may appear squashed or stretched because the display aspect ratio differs from the source aspect ratio. Consider using a smart cropping method to make your asset fit the available space without losing important details.
Inspect a single media file
To see information about a single media file:
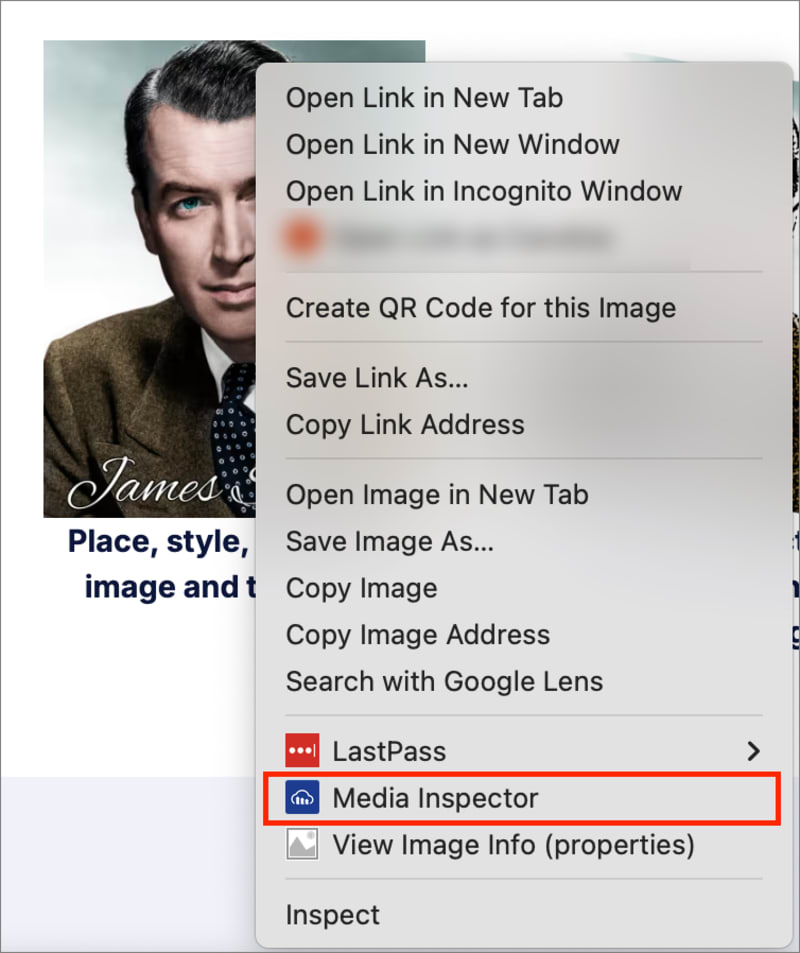
- Right-click the media file in your browser.
- Click Media Inspector to open the Media Details view.
The Media Details view displays a summary of the media file as well as four tabs with more detailed information about the media.
Summary tab
The Summary tab displays general information about the image or video, including file type, size, dimensions, and the colors detected in the media file.
In the Original vs Derived section, you can see how the served image differs from the original image stored in Cloudinary, highlighting the optimizations.
Transformation tab
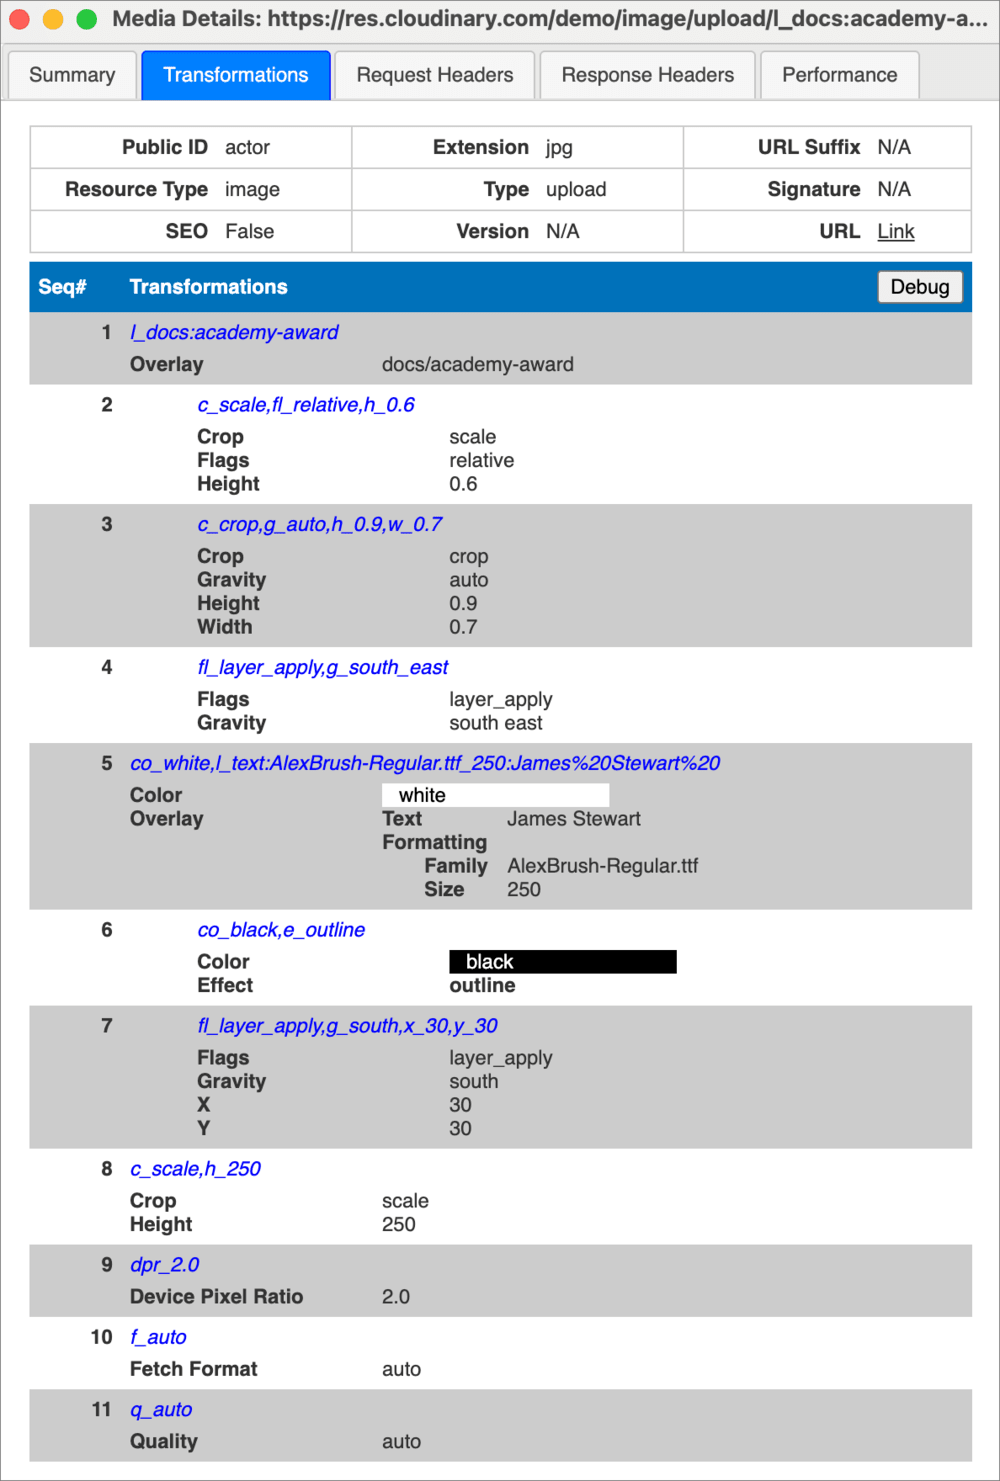
The Transformation tab displays a breakdown of all individual Cloudinary transformations applied to the media file:
From here, you can also launch the Transformation Debugger to debug the transformation components by adding or removing them one by one:
Request and Response headers tabs
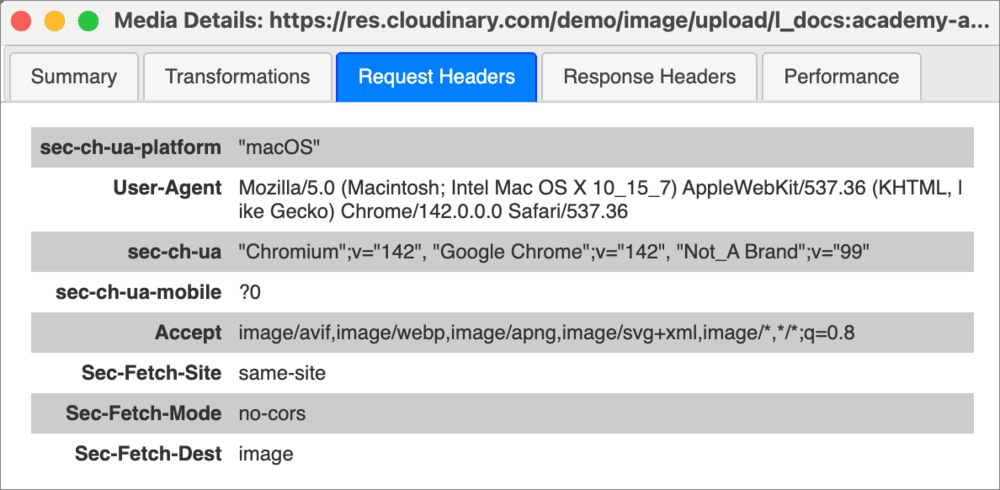
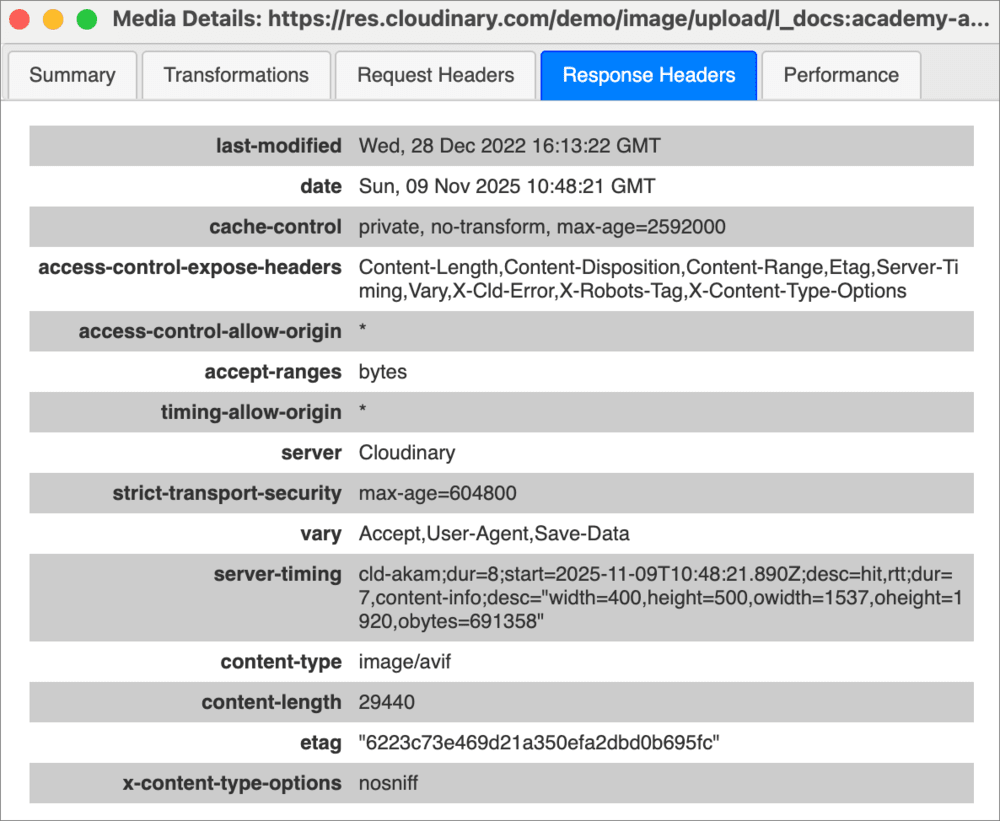
The Request headers and Response headers tabs display the HTTP request and response headers that were sent when viewing the media file.
Performance tab
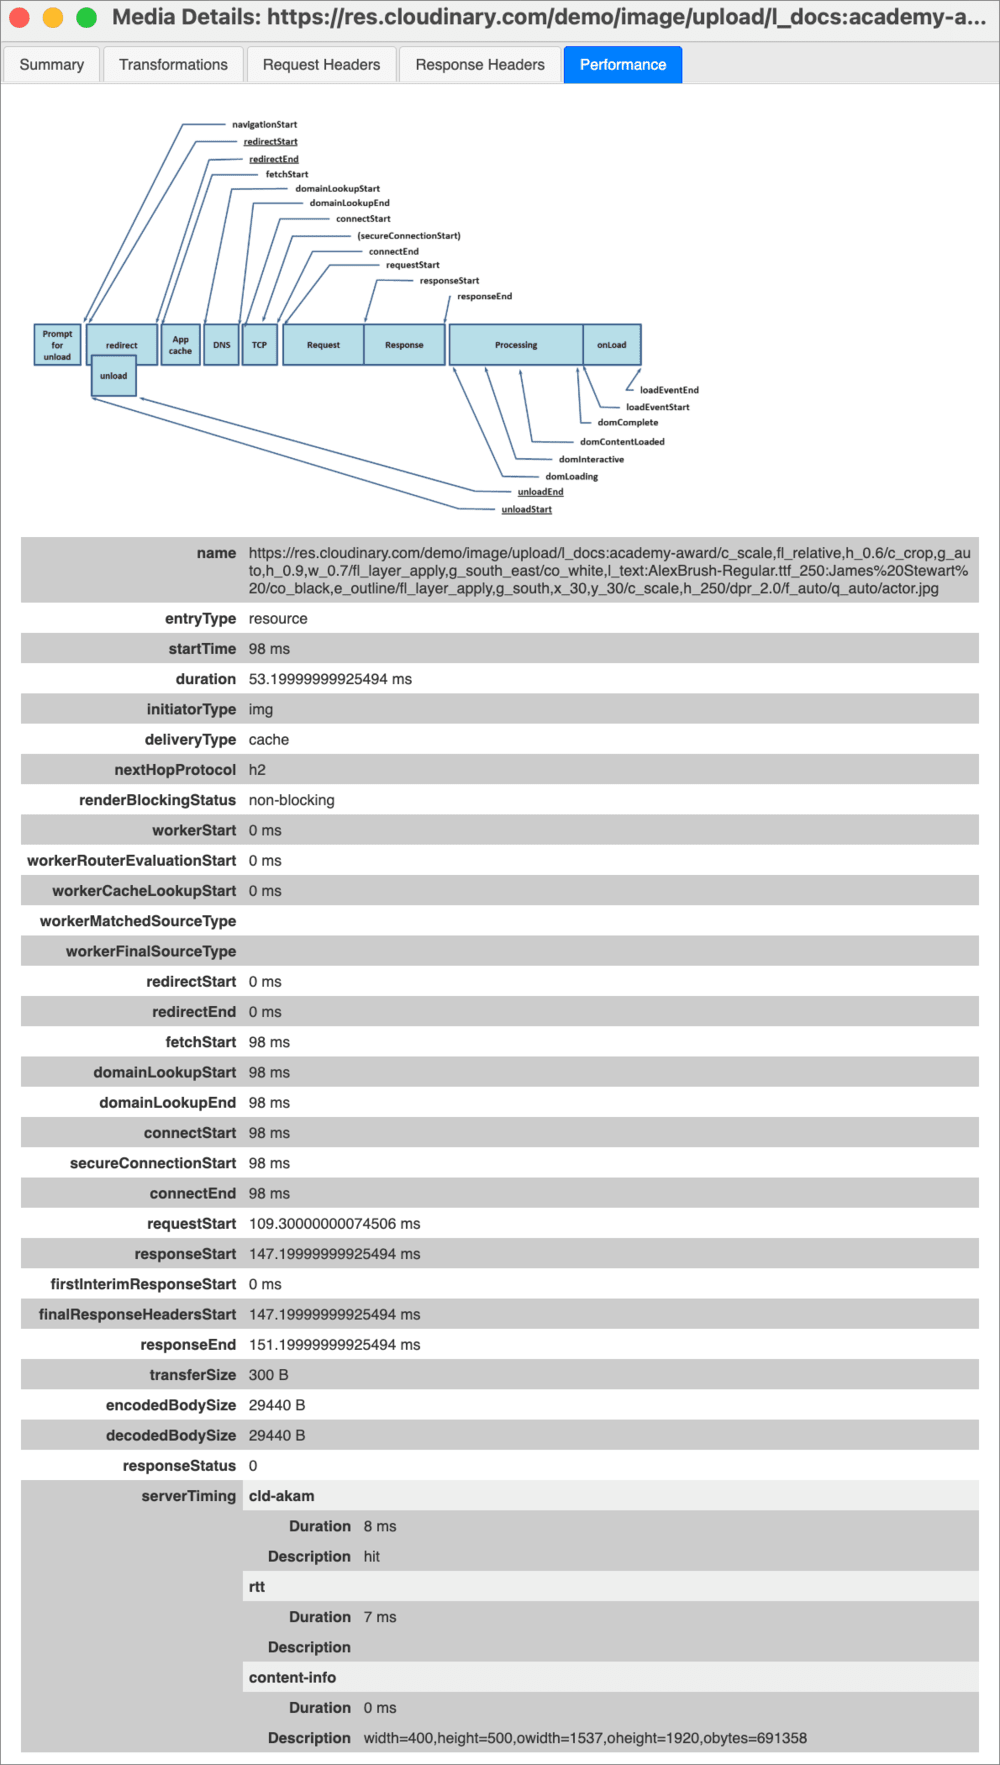
The Performance tab displays performance metrics for the image or video, including the time it took for the various stages of loading the media asset.
- Learn more about our Optimization and Transformation features.
 Ask AI
